

Introduction
Analysis of Optical Properties of Electrochromic and PDLC Glasses
Building Energy and Daylight Performance Evaluation
Simulation Analysis Model
Control Method for Solar Control Glasses
Results of Building Energy Performance Evaluation
Daylight Performance Evaluation Results
Conclusion
Introduction
To reduce the energy of buildings and to implement zero-energy buildings, it is important to secure effective solar control performance in addition to improving the insulation performance of the building envelope. The solar control performance of the building envelope is more important in countries such as South Korea where the summer and winter seasons are clearly distinguished.
Regarding next-generation solar control devices for building energy reduction, studies and technical developments for solar control glass, which can control the transmittance of the glass itself, have been actively conducted of late [1]. Types of smart glass include electrochromic, polymer dispersed liquid crystal (PDLC), suspended particle device (SPD), thermochromic, and photochromic [2]. These solar control glasses can control the transmittance by themselves without requiring shade devices such as blinds and rollup shades, and they can easily control the transmittance with electrical signals [3].
As for the properties of solar control glasses, first, electrochromic glass has a wide transmittance range for the entire solar spectrum owing to coloring and decoloring and can be operated at a voltage of 5 Voltage or less [4]. Electrochromic glass requires the application of electricity only when the transmittance needs to be changed, and can maintain its condition without the application of electricity when the desired transmittance is reached [5]. PDLC is the most economical solar-control glass and has a fast response speed of 1 s or less [6]. As it can be easily produced in the form of a film, it can be attached to existing glass or inserted between glass substrates [7]. SPD can be used as a solar control window because its coloring rate is as fast as PDLC compared to electrochromic glass, and its control range of visible light transmittance is wide. SPD materials have been mainly used as automotive mirrors [8]. The transmittance of thermochromic glass varies depending on the temperature, and that of photochromic glass varies depending on the surrounding brightness [9]. The benefit of these types of glass is that their transmittance can be adjusted without a separate power supply. However, this can also be a drawback because the transmittance is automatically controlled even when users do not desire such control [10].
In this study, electrochromic and PDLC glasses, which are under development in South Korea, were applied to an office building, and the building energy and daylight performance were analyzed. In addition, their applicability as next-generation solar control devices was examined.
Analysis of Optical Properties of Electrochromic and PDLC Glasses
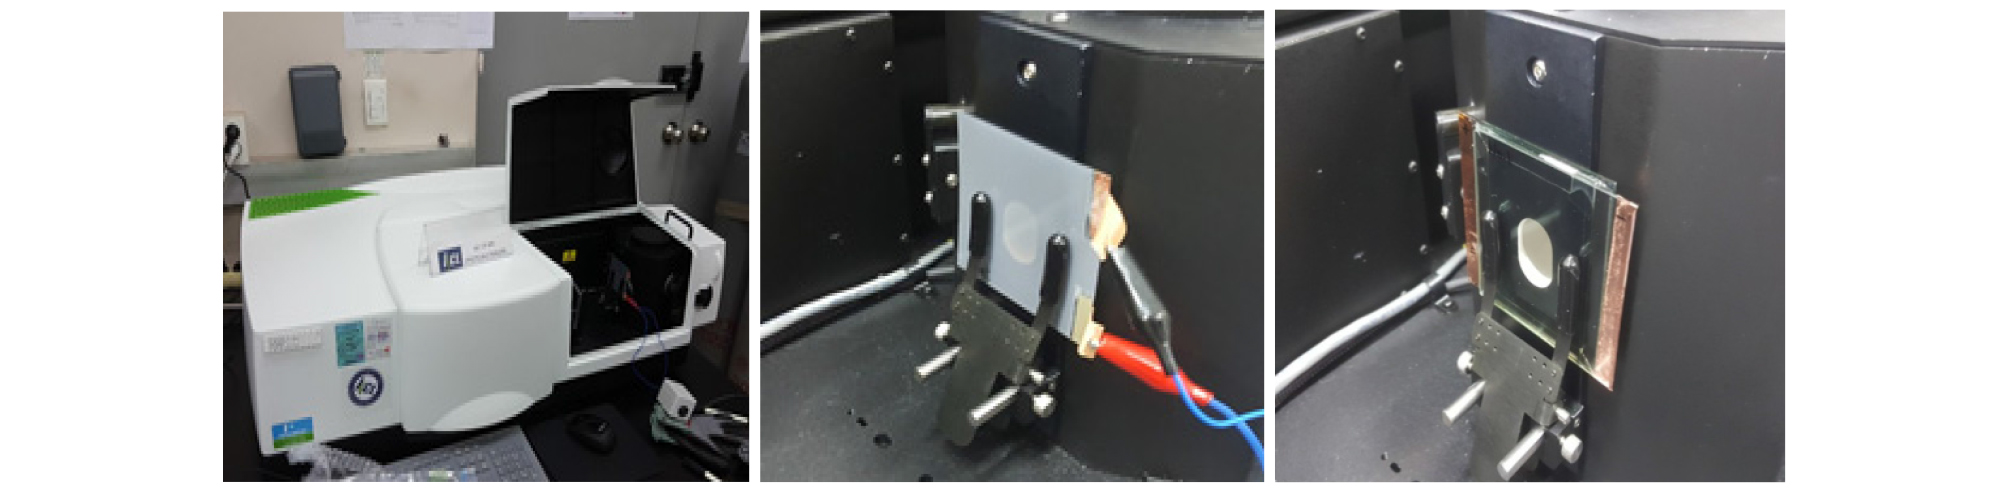
To analyze the optical properties of electrochromic glass and PDLC, samples in a 70 mm × 70 mm size were prepared as shown in Figure 1, and experiments were performed using a spectrometer. The transmittances and reflectances on the front and rear surfaces of each specimen in the 0.3 ~ 2.5 ㎛ solar spectrum wavelength range were measured.
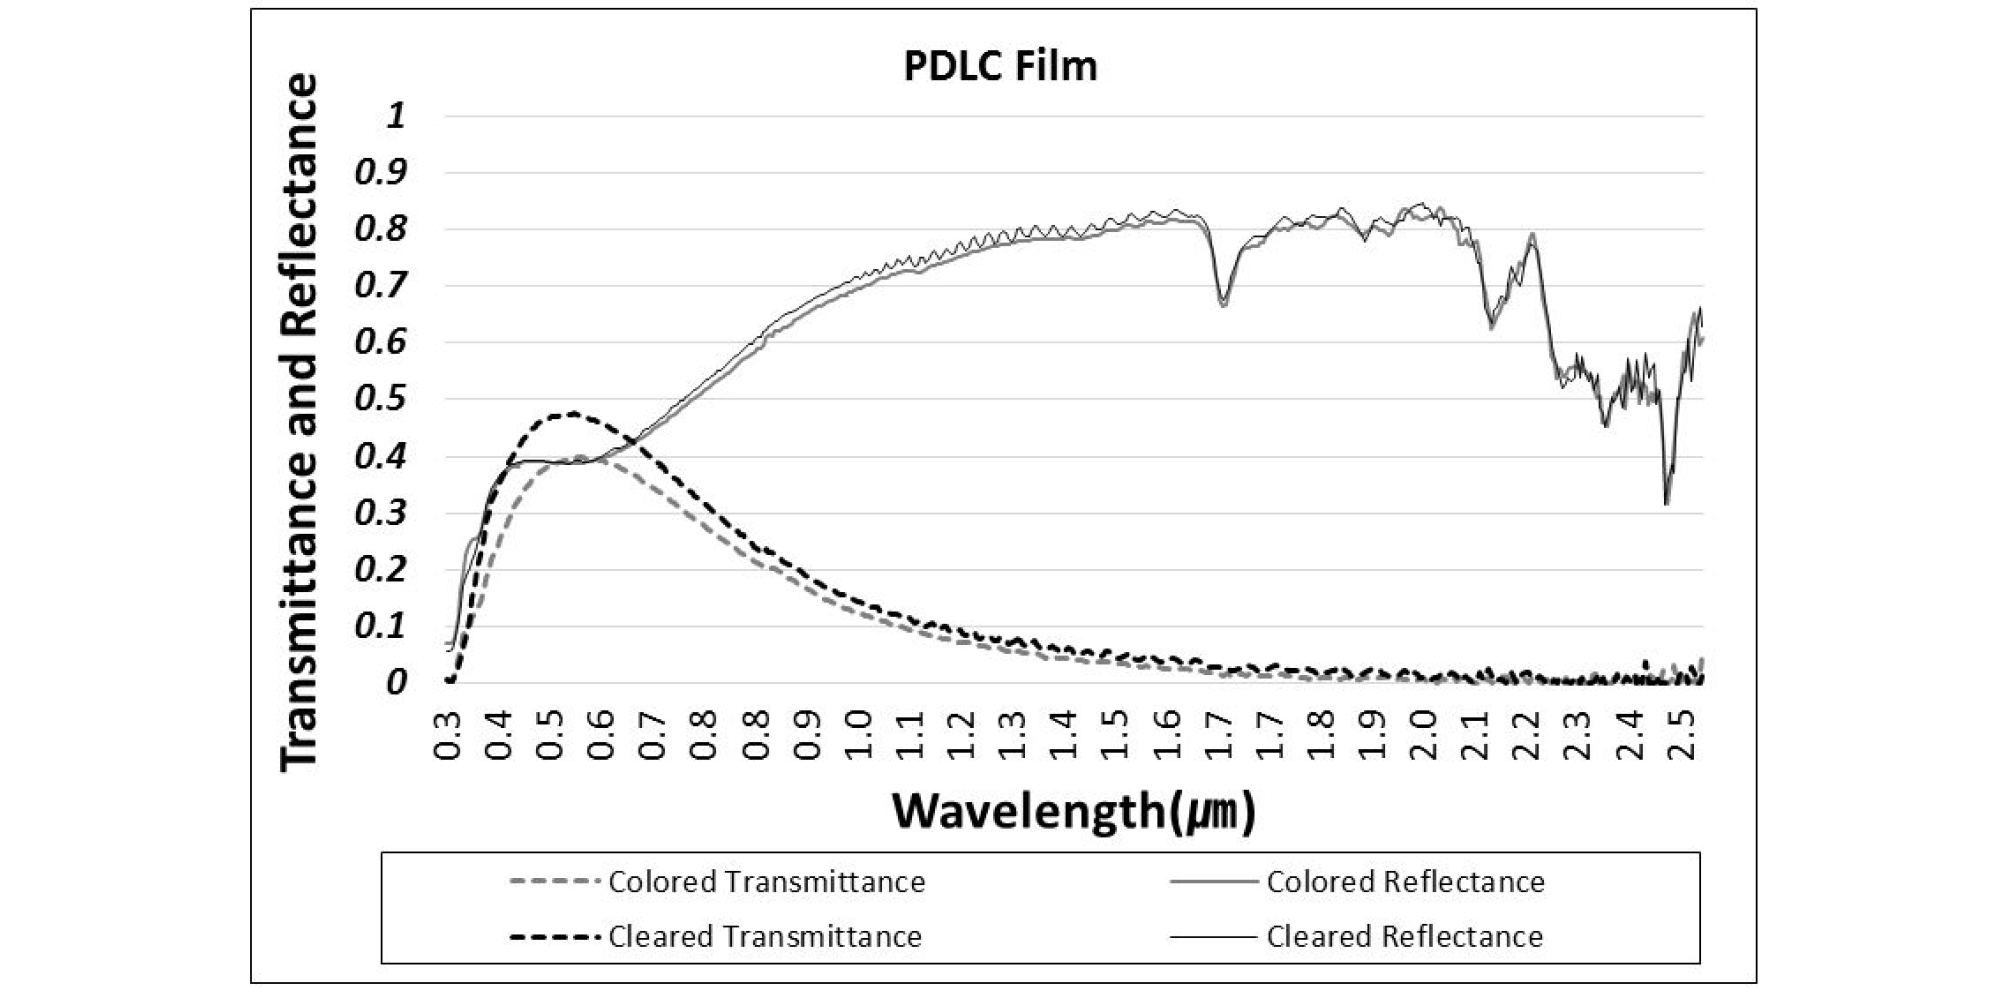
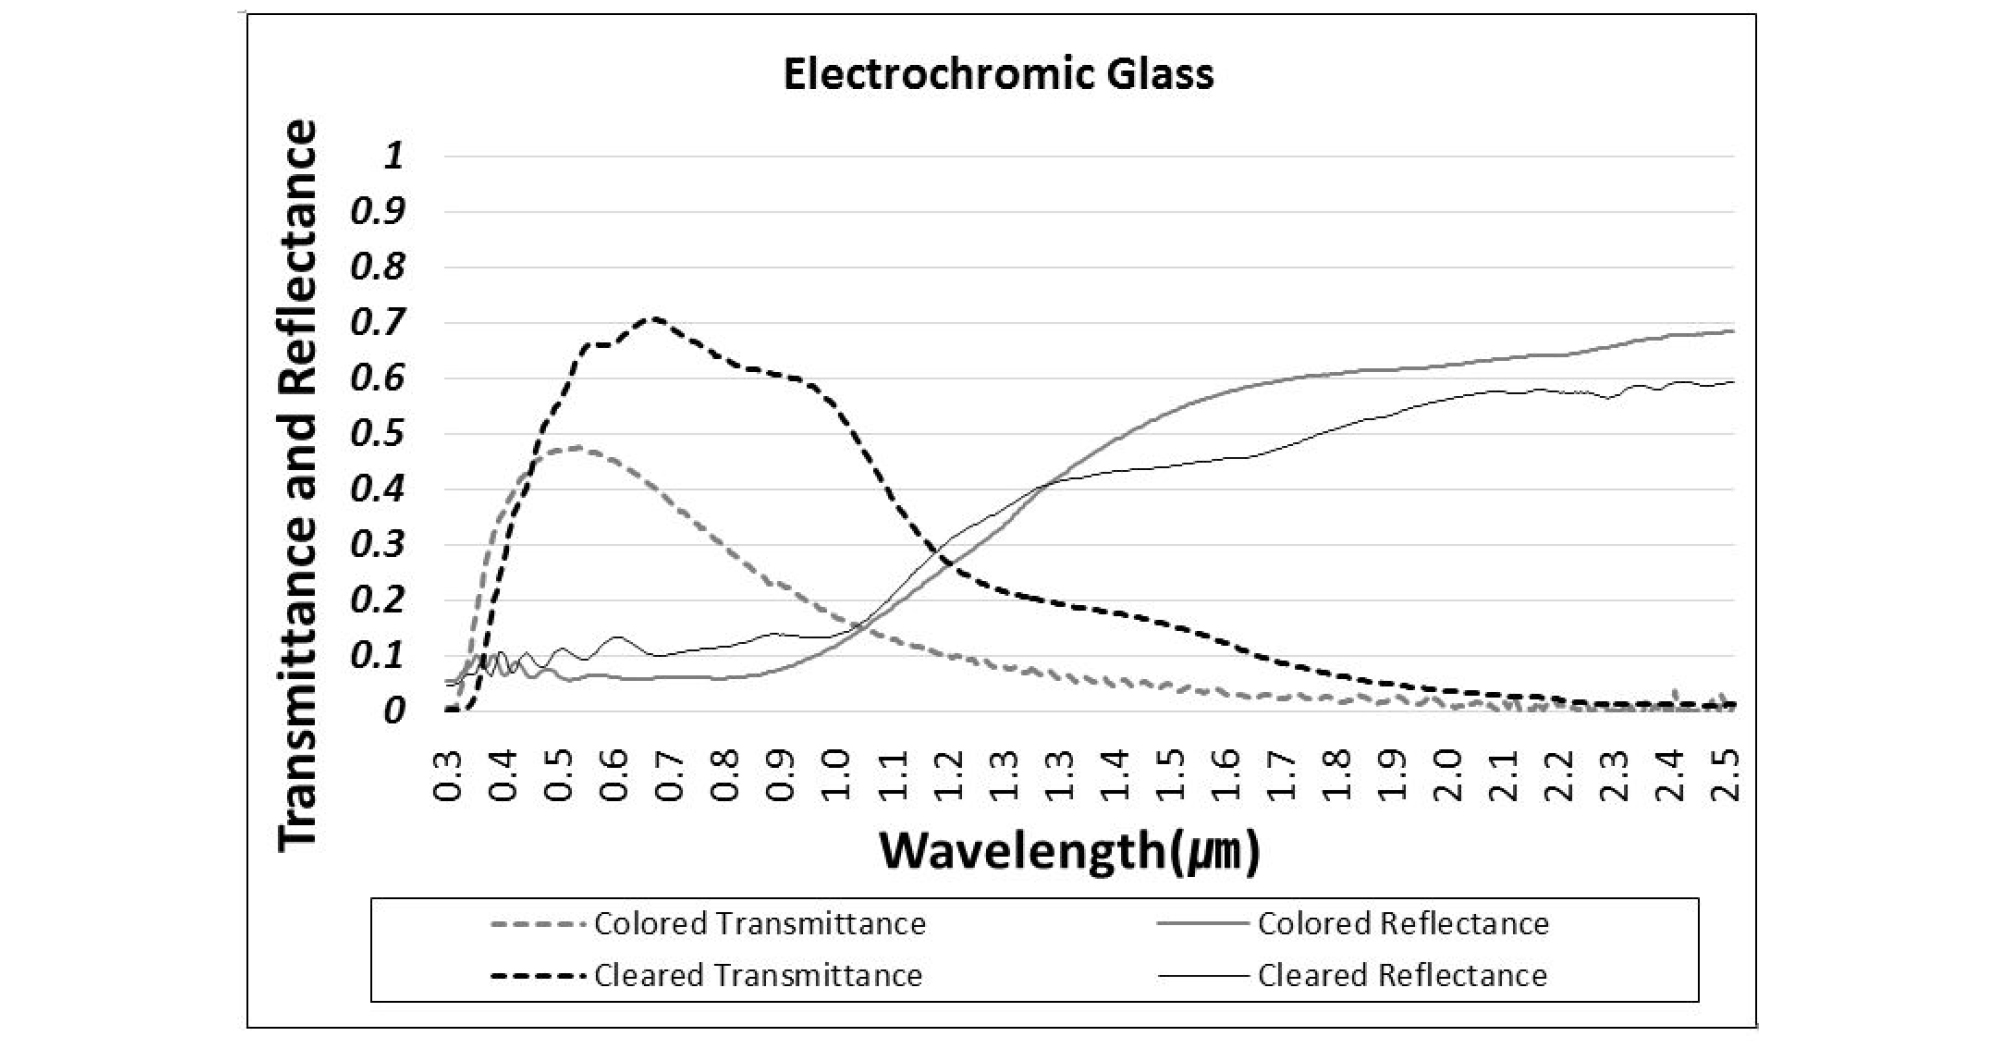
The analysis of the optical properties showed that the solar transmittance of electrochromic glass was 6.5% in the colored state and 48.1% in the clear state, indicating a 41.6% difference. The solar transmittance of PDLC was 23.0% in the colored state and 27.3% in the clear state, showing a 4.3% difference. The visible light transmittance of electrochromic glass was 12.0% in the colored state and 64.8% in the clear state, resulting in a 52.8% difference. The visible light transmittance of PDLC was 38.9% in the colored state and 45.9% in the clear state, showing a 7.0% difference. (as in Table 1). As electrochromic glass exhibited wider solar and visible-light transmittance ranges than PDLC, its solar control performance was found to be higher. Electrochromic glass is also expected to be more effective in blocking solar radiation owing to its lower transmittance in the colored state.
Table 1. The average spectral data of Electrochromic glass and PDLC film
Figures 2 and 3 show the spectral data of PDLC film and electrochromic glass. Changes in transmittance and reflectance for the entire solar spectrum can be seen.
By using a simulation tool, this study aimed to analyze the building energy and daylight performance owing to the application of electrochromic glass and PDLC. To simulate the building energy, it is necessary to derive the thermal transmittance, solar heat gain coefficient (SHGC), and visible light transmittance of double glazing using data on optical properties.
First, for the lamination of PDLC, which was subjected to spectroscopic analysis in the form of a film, onto glass, PDLC was reconstructed (4 mm clear + PDLC film + 4 mm clear) as shown in Table 2, and its optical properties were derived using the Lawrence Berkeley National Laboratory (LBNL) Optic 6 software [11].
Table 2. The average spectral data of PDLC film and PDLC laminated glass
Second, double glazings were constructed with electrochromic or PDLC glass (8 mm electrochromic or PDLC glass + 12 mm air + 6 mm low-e glass) using LBNL’s Window 7.4 software, and their thermal transmittances, SHGCs, and visible light transmittances were derived as shown in Table 3. The simulation conditions followed the Korean Industrial Standard (KS) F 2278. The thermal and optical properties were derived at a high-temperature-side air temperature of 20°C, low-temperature-side air temperature of 0°C, indoor surface heat transfer coefficient of 9.09 W/m2K, and outdoor surface heat transfer coefficient of 20.0 W/m2K.
Table 3. Thermal and optical properties of double glazings
Based on the derived thermal and optical properties of the electrochromic and PDLC double glazings, the building energy and daylight performance are evaluated in the next chapter.
Building Energy and Daylight Performance Evaluation
Simulation Analysis Model
In this study, EnergyPlus 8.5 developed by the US Department of Energy (DOE) was used as a simulation tool. EnergyPlus provides a switchable glazing component that can control the transmittance of glass according to changes in indoor and outdoor environments, making it easy to analyze the building energy for smart windows [12, [13], 14]. It also provides a component to analyze the glare of a window using the daylight glare index (DGI) developed by Hopkinson, and can evaluate the indoor illuminance by using a daylight sensor [15, 16].
Figure 4 shows the floor plan of the analysis model for simulation and the building façade. The floor plan of the analysis model is shown on the left side of Figure 4. Its floor area was 50 m × 50 m, and its floor height was 3 m. The window area ratio was set to 60%. The floor plan was divided into a core zone and perimeter zones. In this study, the south, east, and west perimeter zones, which were directly affected by solar radiation, were analyzed. The Energyplus 8.5 analysis model that utilized OpenStudio is shown on the right side of Figure 4. A three-story office building was modeled, and the middle floor was analyzed.
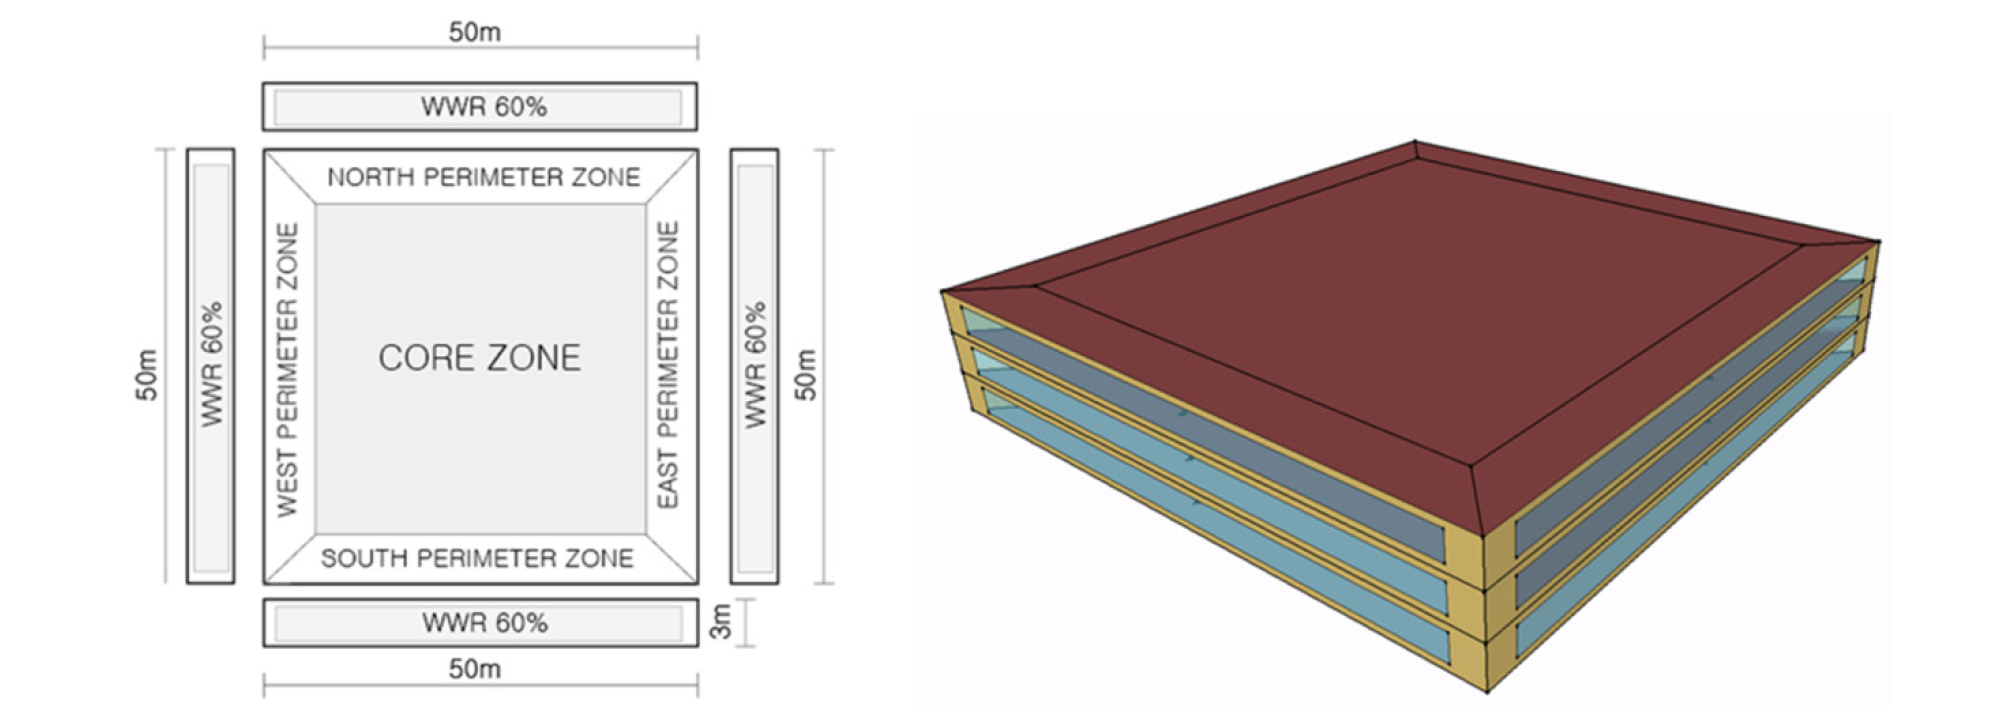
Table 4 shows the exterior wall of the analysis model. It was constructed in accordance with the building energy-saving design criteria (2019). The temperatures of the analysis model were set to 20 and 26°C, respectively, in accordance with the indoor temperature criteria for calculating the cooling and heating equipment capacity in the building energy-saving design criteria. As for heating, ventilation, and air conditioning (HVAC), the IdealLoadsAirSystem provided by EnergyPlus was applied to a load analysis that excluded the interference of system variables as much as possible. For the internal heat gain, overhead lighting of 10.8 W/m2, peak occupancy of 22.3 m2/person, and equipment of 8.6 W/m2 were applied in accordance with the standards of ASHRAE(American society of heating, refrigerating and air-conditioning engineers) Fundamentals (2009) [17]. For the internal heat gain schedules of the human body, lighting, and equipment, Office Schedule provided by the Schedules of DataSets of EnergyPlus was applied. For the outside air inflow rate, 1.1 m3/m2h was applied in accordance with the regulations of the building energy efficiency rating system [18].
Table 4. Thermal properties of the exterior wall of the analysis model
The weather data in Incheon, which has a continental climate with an annual temperature difference of up to 30°C owing to the influence of the cold high pressure of the continent in winter and the hot and humid maritime air mass in summer, were used. These weather data were provided by the EnergyPlus web site.
Control Method for Solar Control Glasses
Smart-glass control methods can be divided into manual control by the user and automatic control by the external environment. Automatic control has variables such as time, outside air temperature, indoor temperature, external solar radiation, and external illuminance. In this study, a control method to reduce the building energy by blocking solar radiation in summer and by introducing it in winter was selected under the climatic conditions of South Korea, where the summer and winter seasons are clearly distinguished.
In this study, the summer season was defined as the period from May to October, and the winter season as the period from November to April. The performance of the solar control glass was evaluated in the colored state for the summer season and in the clear state for the winter season.
Results of Building Energy Performance Evaluation
In this chapter, electrochromic and PDLC double glazings were applied to an office building, and their energy consumption compared to that of a conventional low-e double glazing were examined when the transmittance was controlled for both the cooling and heating periods.
First, for SHGC that directly affects the building energy, the electrochromic double glazing exhibited 0.127 in the colored state and 0.411 in the clear state, resulting in a 0.284 difference. The SHGC of the PDLC double glazing was 0.222 in the colored state and 0.252 in the clear state, exhibiting a 0.030 difference, which was smaller than that of the electrochromic double glazing.
Based on the properties of the two solar control glasses, it is expected that the energy reduction performance of the electrochromic double glazing will be higher than that of PDLC when the transmittance is controlled for both the cooling and heating periods.
Table 5 lists the energy consumption of each double glazing. The total annual energy consumption was found to be 52,806.1 kWh for the low-e double glazing, which was the baseline; 36,052.0 kWh for the electrochromic double glazing; and 39,526.0 kWh for the PDLC double glazing. As expected, the electrochromic double glazing exhibited the best performance.
Table 5. Energy consumption by glazing type
Figure 5 shows the energy consumption reduction rate compared to the baseline. The reduction rate was found to be 31.7% for electrochromic double glazing and 25.1% for PDLC double glazing. Although the electrochromic double glazing showed a higher performance, it can be said that both of them exhibited excellent performance as solar control glass because they could save more than 25% energy compared to conventional low-e double glazing.
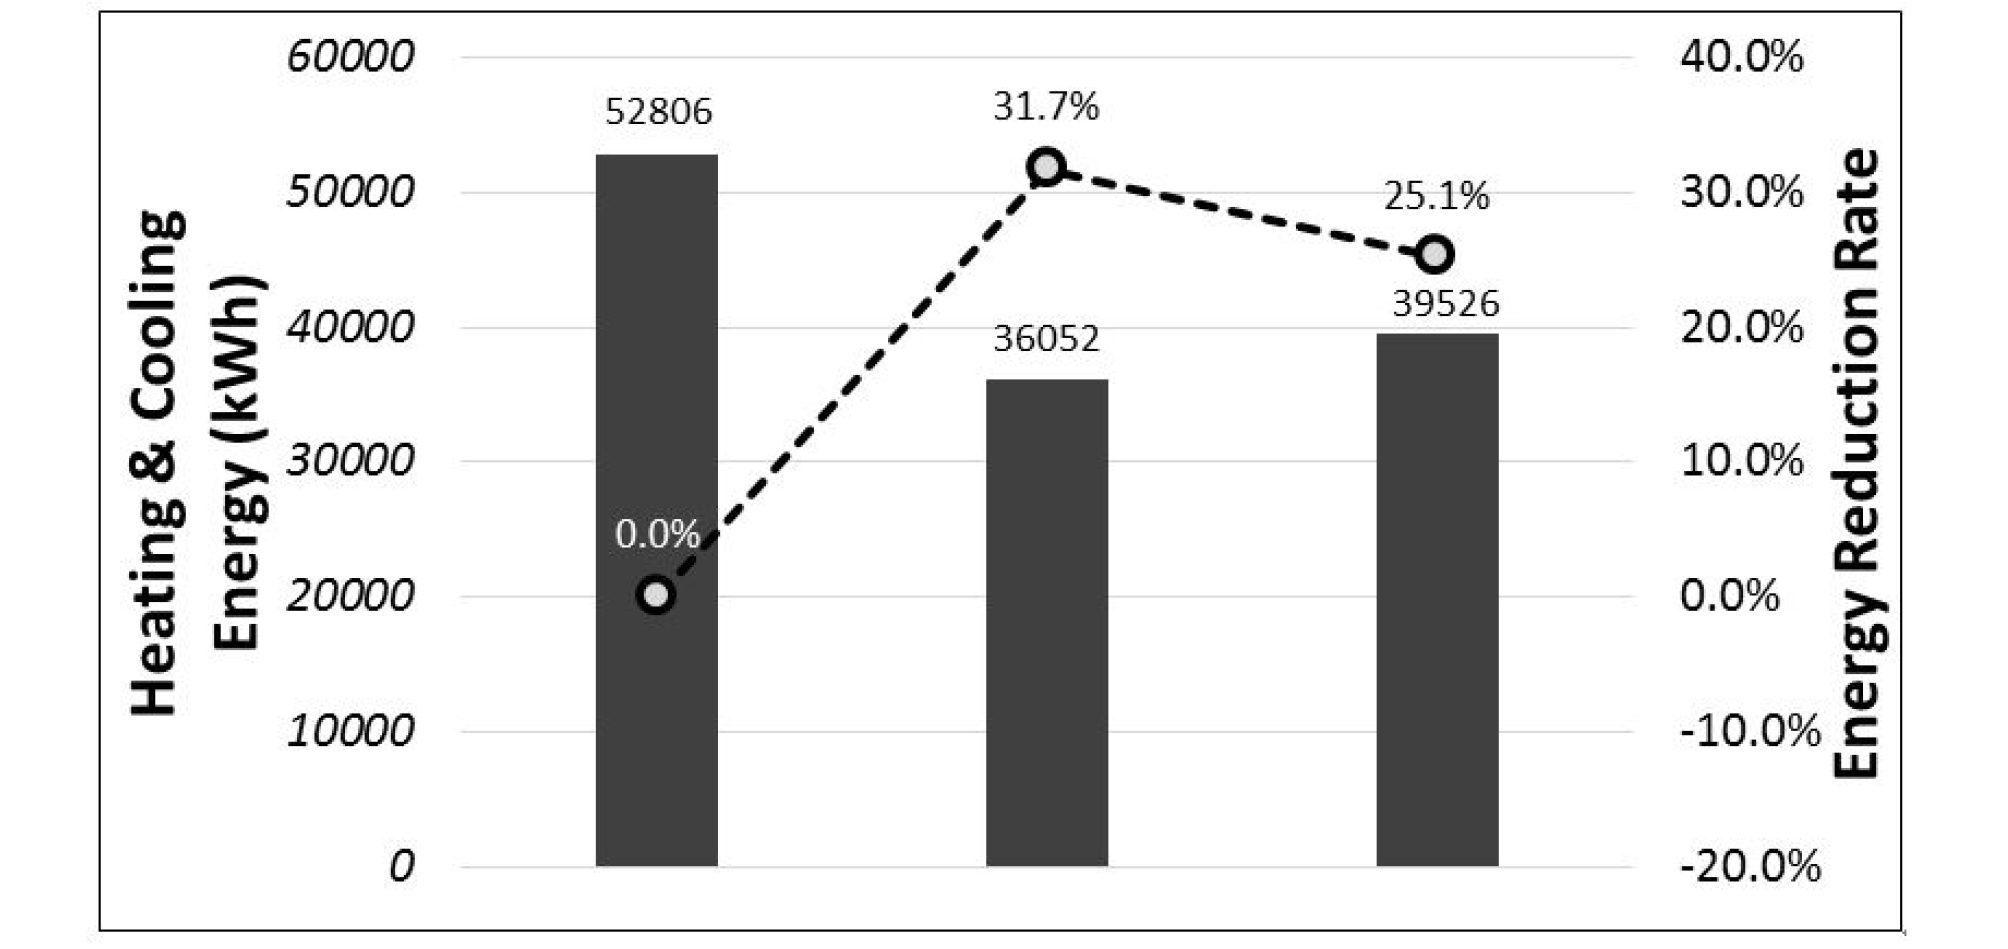
Figure 6 shows the monthly energy consumption of each double glazing in a graph. Through the graph, seasonal energy consumption tendencies could be identified. First, for the heating energy consumption in the winter season, the electrochromic and PDLC double glazings with low SHGC values exhibited higher energy consumption than the low-e double glazing. The PDLC double glazing with a low transmittance in the clear state exhibited the highest energy consumption, followed by the electrochromic and low-e double glazings.
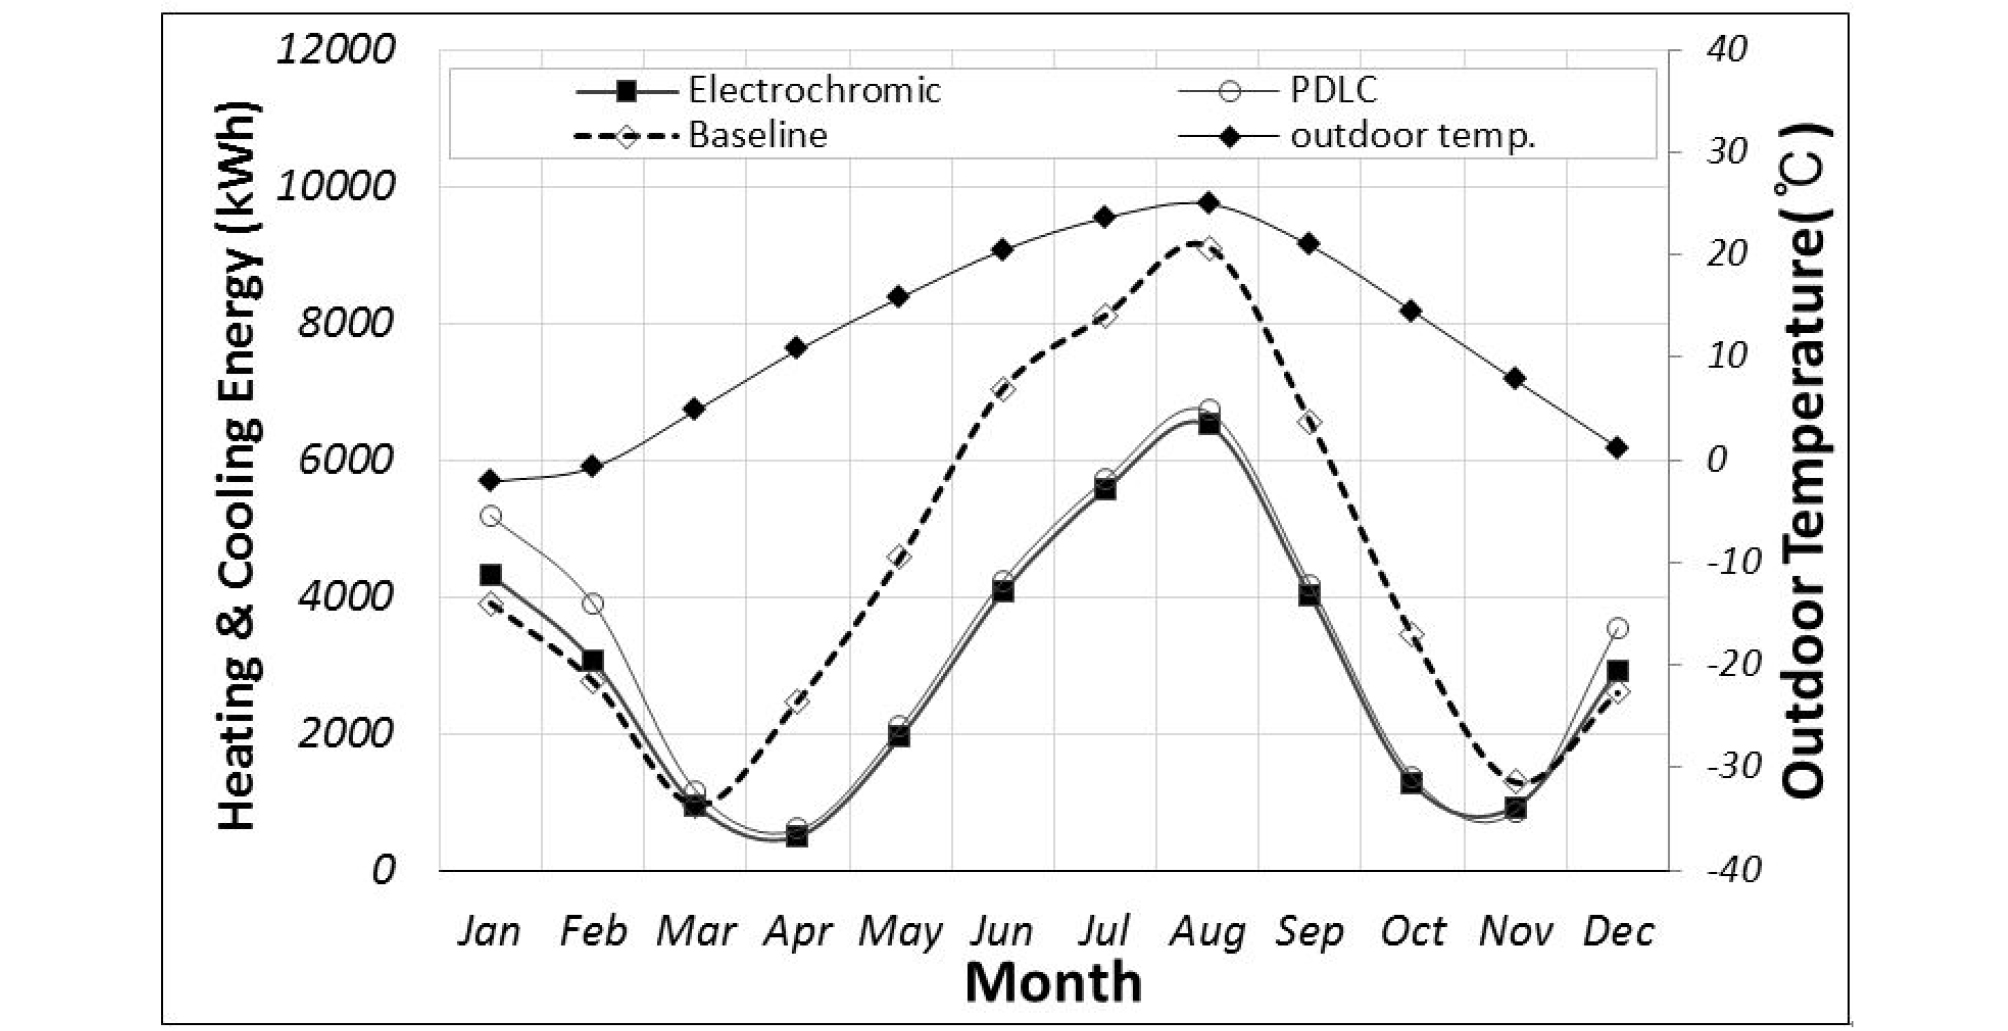
Meanwhile, the cooling energy consumption in the summer season could be significantly reduced by applying electrochromic and PDLC double glazings. This is because the transmitted solar radiation could be blocked as the SHGC of the electrochromic double glazing was reduced to 0.127 and that of the PDLC double glazing to 0.222 in the colored state, while the SHGC of the conventional double glazing was as high as 0.578.
Table 6 lists the seasonal energy consumption. As shown in the table, the energy consumption in the summer season could be reduced by 34.6% for electrochromic double glazing and 32.4% for PDLC double glazing compared to low-e double glazing. In the intermediate period, the reduction rates were found to be higher than in the other seasons. The reduction rates were 56.0% for electrochromic double glazing and 52.3% for PDLC double glazing. In the winter season, the energy consumption increased by 11.3% for electrochromic double glazing and 36.3% for PDLC double glazing compared to low-e double glazing, resulting in an approximately 25.0% difference.
Table 6. Seasonal Energy consumption by glazing type
The annual energy consumption could be reduced by 31.7% for electrochromic double glazing and 25.1% for PDLC double glazing, indicating that solar control was effective for energy reduction. PDLC double glazing showed lower energy reduction rates than electrochromic double glazing because its transmittance range was narrower owing to its optical properties. In addition, its transmittance was lower in the clear state, causing a difference in energy consumption in the winter season.
Daylight Performance Evaluation Results
In this chapter, electrochromic and PDLC double glazings were applied to an office building, and possible improvements in the daylight performance compared to conventional low-e double glazing were examined when the transmittance was controlled for both the cooling and heating periods.
First, for the visible light transmittance that directly affects the building energy, electrochromic double glazing exhibited 0.096 in the colored state and 0.521 in the clear state, resulting in a 0.425 difference. The visible light transmittance of PDLC double glazing was 0.316 in the colored state and 0.373 in the clear state, showing a 0.057 difference, which was smaller than that of electrochromic double glazing.
In this study, the daylight performance was evaluated by analyzing the annual time ratios of discomfort glare and comfort daylight illuminance. First, to analyze the annual time ratio of discomfort glare, a reference point was installed at a distance of 1.5 m and height of 1.65 m from the window of the simulation analysis model (as in Figure 7). The discomfort glare that occurred when the window was watched from this reference point was analyzed through the daylight glare index (DGI), which was provided by the EnergyPlus simulation tool. The DGI, which was developed by Hopkinson [19], is an index for the subjective daylight performance of glare. It provides recommended values for different building uses, as shown in Table 7. In this study, DGI 22 was applied because the daylight performance was analyzed for an office building. Reference points were used to analyze the indoor illuminance. For an illuminance analysis, two reference points were set at a 1.5 m interval.
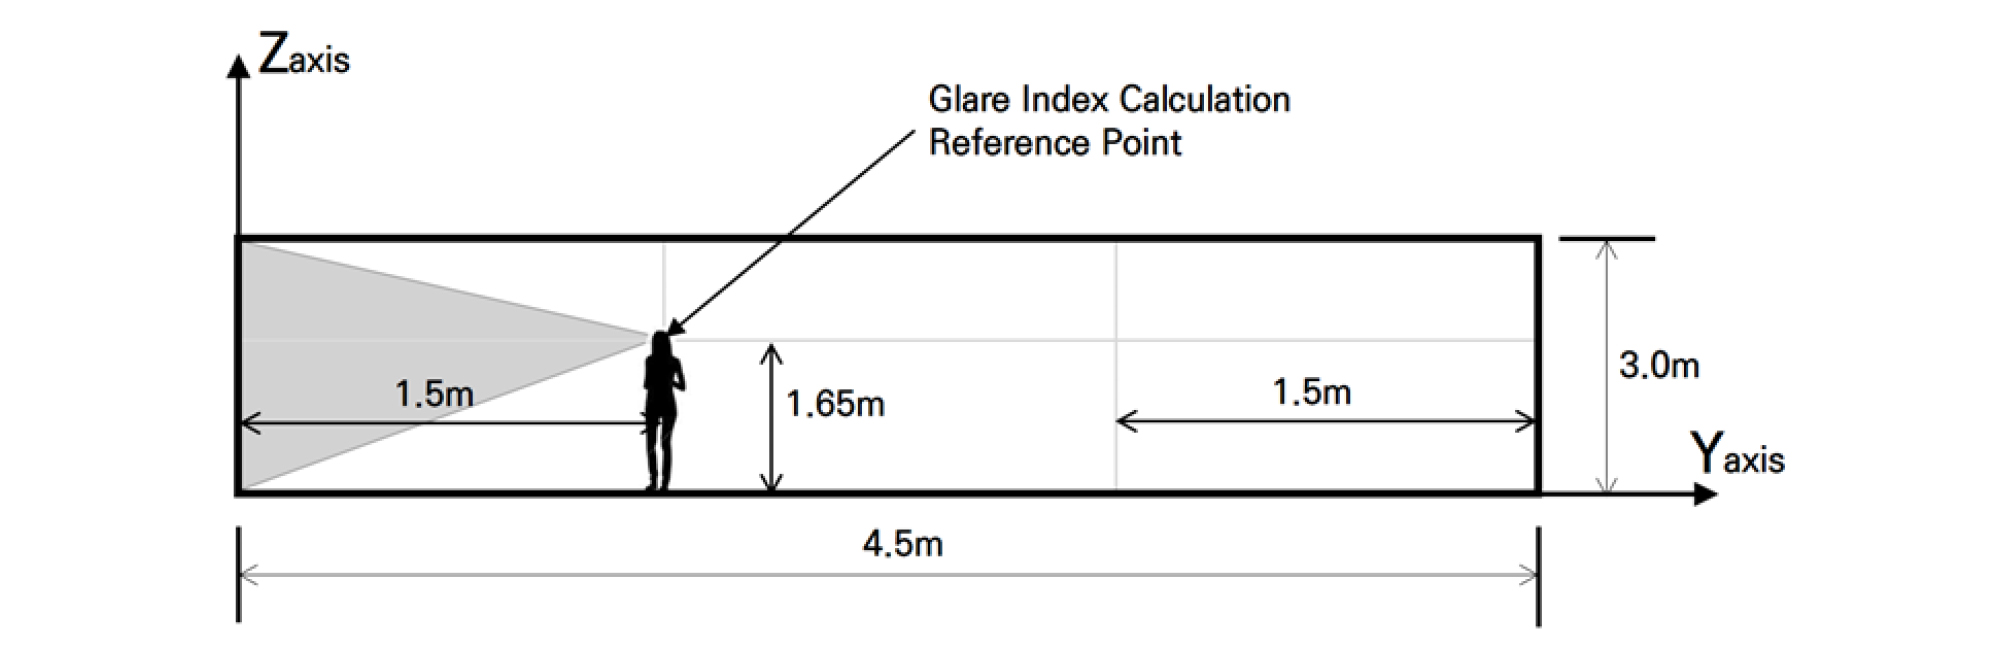
Table 7. Hopkinson's recommended values for DGI by use
| Division | Recommended value |
| Art galleries | 16 |
| Hospital wards | 18 |
| Museums, School classroom | 20 |
| Laboratories, Offices | 22 |
Table 8 lists the annual time ratios for DGI 22 by direction. The average values by direction in Table 6 indicate that the annual time ratio of the discomfort glare was reduced by 64.6% for electrochromic double glazing and 78.5% for PDLC double glazing compared to low-e double glazing.
Table 8. Annual time ratio of higher DGI 22
PDLC double glazing was found to be more favorable than electrochromic double glazing in terms of the annual discomfort reduction because the visible light transmittance of the latter was higher than the former in the clear state in the winter season, even though the latter exhibited lowest visible-light transmittance in the colored state.
In other words, when controlled in the clear state for the winter season and in the colored state for the summer season, the electrochromic double glazing was more favorable in terms of the energy reduction, but the PDLC double glazing exhibited a higher discomfort glare reduction effect owing to its narrower visible light transmittance range and lower transmittance in the clear state.
Table 9 lists the annual time ratios of comfort daylight illuminance by direction. For the comfort daylight illuminance criteria, the appropriate illuminance range for office buildings suggested by the KS A 3011 standards, i.e., 150–1,500 lx, was applied [20].
Table 9. Annual time ratio of comfort daylight illuminance(150 lx`1500 lx)
When the annual time ratio of the comfort daylight illuminance was analyzed, it was found that the time ratio was higher when electrochromic and PDLC double glazings were applied, compared to low-e double glazing. Electrochromic double glazing (54.4%) exhibited a 155.2% increase and PDLC double glazing (52.5%) a 149.1% increase compared to low-e double glazing (35.6%). This indicated that the daylight performance can be improved.
Conclusion
In this study, two types of solar control glasses, i.e., electrochromic and PDLC double glazings, were applied to an office building, and the building energy and daylight performance were analyzed.
First, the optical properties of the electrochromic glass and PDLC film were examined, and their thermal and optical properties as double glazings were analyzed using the LBNL Window 7.4 tool. It was found that the solar heat gain coefficient and visible light transmittance ranges of the electrochromic glass were wider than those of PDLC. Therefore, it was expected that the electrochromic double glazing would have a higher energy-reduction performance under the climatic conditions of South Korea, where the summer and winter seasons are clearly distinguished. Based on this assumption, an analysis model of the office building was constructed, and the control conditions were divided into the summer (June to September) and winter seasons (October to May). The building energy and daylight performance were analyzed in the colored state for the summer season and in the clear state for the winter season.
The analysis of the building energy performance revealed that electrochromic double glazing could save 31.7% energy and PDLC double glazing 25.1% energy compared to conventional low-e double glazing. Although electrochromic double glazing showed a higher performance, both of them exhibited excellent performance as solar control glass because they could save more than 25% energy compared to conventional low-e double glazing.
When the discomfort glare reduction performance, which corresponds to the daylight performance, was analyzed, it was found that PDLC double glazing exhibited a higher discomfort glare reduction effect than electrochromic double glazing owing to the former’s narrower visible-light transmittance range and lower transmittance in the clear state. This is because the PDLC double glazing with a lower visible-light transmittance is more favorable in terms of the discomfort glare reduction when the clear state is maintained in the winter season.
When the time ratio of the comfort daylight illuminance, which corresponds to the daylight performance, was analyzed, electrochromic double glazing (54.4%) exhibited a 155.2% increase and PDLC double glazing (52.5%) a 149.1% increase compared to low-e double glazing (35.6%), indicating that they improved the time ratio of appropriate indoor illuminance. Although electrochromic double glazing exhibited a slightly higher performance, it was not significant because the difference was not large. Both types of solar control glass are considered to be effective in improving the daylight performance.
This study had limitations because the target solar-control glass was limited to a single type of electrochromic glass and PDLC film, and the control methods were also limited to the clear state for the winter season and the colored state for the summer season. In addition, a simulation with the building energy analysis model was performed under limited conditions with regard to geometry, internal heating, schedule, and set temperature. Therefore, the results of this study cannot be generalized.
This study, however, is significant in that the possibility of improving the performance of a building was examined by analyzing the building energy and daylight performance using electrochromic glass and PDLC film developed in South Korea. Further research will be conducted with regard to the types of solar control glass, control methods, and diversity of analysis models.
