

Introduction
Necessity of Proposing GHG Evaluation Method
Greenhouse gas emission control and evaluation system for public buildings
Current status of support systems for GHG emission management
The necessity of developing support systems for a GHG emission management system
Survey to Identify the Direction of Evaluation
Material and Methodology
GHG Evaluation DB of Energy end use
Significance verification of the emissions DB by end use
Case Study
Conclusions
Introduction
In order to achieve the greenhouse gas reduction target, energy saving in the building sector is being emphasized at home and abroad, and many countries have greatly strengthened policies and technical support for greenhouse gas reduction.
In addition, it emphasizes the leading role of the public sector and enforces design standards for public buildings and zero-energy buildings. In the United States, LEED certification is mandatory for new public buildings, and tools are provided to support them. In addition, the EU is promoting 100% zero energy for new public buildings by 2020, and will be required to submit energy performance reports [1].
In the case of Korea, to reduce national GHG emissions through the leading role of public institutions, it was compulsory to reduce GHG emissions by public institutions, including the “healthy implementation system for a new climate system,” as part of the 100 national government projects. However, the lack of experts in related fields and the lack of understanding of the system are the biggest problems in the operation of the system [2].
Accordingly, this study supports the establishment of an efficient building greenhouse gas reduction plan by public institutions, establishes a database for evaluating the energy use of public buildings and greenhouse gases for each energy source to achieve the target greenhouse gas emissions from setting target greenhouse gas emissions, and We proposed a method for evaluating greenhouse gas emissions.
To this end, a greenhouse gas evaluation DB was built using the energy survey data of CBECS (USA, 2012), which is the energy consumption data of the public and commercial sectors, and the energy consumption data of public institutions. A greenhouse gas evaluation method was proposed [3].
Necessity of Proposing GHG Evaluation Method
Greenhouse gas emission control and evaluation system for public buildings
The energy performance evaluation of public buildings is executed by establishing an action plan and preparing a report of results according to legal requirements (Table 1). There are two types of GHG emission control and evaluation schemes depending on the characteristics of the evaluation: individual-based and aggregate-based [4]. In fact, most of GHG emission control and evaluation schemes in the public sector adopt an aggregate-based evaluation that defines the total amount of energy consumption and control energy consumption below a certain level.
Table 1.
Domestic and international public building GHG management system
In the U.S., small and mid-sized buildings must report annual energy and water consumption and release this information to the public. In 2011, the country implemented the US Climate Change Action Plan and as a result US GHG emission in 2017 decreased by 25% compared to 2005. Furthermore, the country developed a web-based benchmarking tool to scrutinize and review the energy use of public buildings [5]. More than 35% of public buildings use this benchmarking tool and more than 2,000 public institutions are currently registered in the system [6]. Countries such as the UK, Canada, and New Zealand not only enforce regulations but also provide support programs for institutions and public buildings pursuing GHG emission and energy consumption reduction strategies (Table 1). They assign energy and emission reduction goals to individual institutions, monitor energy consumption data, and release the data to the public. The UK, an effort to drastically reduce GHG emissions from public buildings established Salix Finance, a government-funded non-profit organization that provides the public sector with interest-free loans for energy efficiency projects [7].
Canada mandates the release of monitoring information on energy usage, which includes energy consumption and benchmarking data [8, 9, 10, 11].
As such, many developed countries conduct energy diagnoses of public buildings according to their uses and identify concrete measures for facility improvement based on GHG emission supporting schemes in the public sector. This leads to substantial reduction in GHG emissions and energy use.
Current status of support systems for GHG emission management
The status of each country’s GHG emission management system for public buildings was investigated in this study and the next steps for evaluation schemes in South Korea were explored.
South Korea’s public institutions set annual targets for GHG emission reduction via the National Greenhouse Gas Emission Management System (NGMS), which supports the Emission Trading Scheme (ETS) and the Target Management System (TMS). Although the government encourages emissions data recording, no activities beyond data entry and verification take place within the system. In addition, the government has difficulty managing the system because it includes a number of small-scale facilities.
However, many developed countries have established policies as well as support systems. The US Department of Energy (DOE) provides SEED (Standard Energy Efficiency Data Platform), an open source software platform that provides an overall forecast of building energy performance and data from other existing buildings of similar types (Table 2) [12, 13]. Entering parameters such as building type, construction year, and total floor area automatically retrieves information on energy and costs for similar types of buildings.
Table 2.
Domestic and international public building GHG management system support tools
The US Environmental Protection Agency's (EPA) Energy STAR Portfolio Manager assists state and federal offices in examining the energy efficiency of buildings and projecting potential GHG emissions so that they can execute energy performance enhancement programs according to their priorities [14].
The 2050 Pathways created by the UK Department of Energy and Climate Change (DECC) is a tool designed to calculate and predict the country’s GHG emissions. It is available online and as standalone software [15]. The tool predicts GHG emissions associated with energy production and consumption by the industrial sector and presents the results. China’s GHG accounting tool is used to support reduction and management of GHG emissions in Chinese cities by evaluating GHG emissions from the building, transportation, and waste sectors [16].
An analysis of different countries’ support tools for GHG emission management systems reveals that most countries evaluate GHG emissions based on energy use and offer projection tools. Therefore, for the South Korean government to successfully operate and support GHG emissions management systems for public buildings, a highly efficient evaluation tool in terms of analytic capability and utilization must be developed. Such a tool must also consider the purpose of the building, its energy consumption, and its the sources of energy.
The necessity of developing support systems for a GHG emission management system
GHG emission management systems for public buildings in many developed countries are distinctive, in that they not only regulate GHG emissions, but also provide supporting tools. Public institutions in these countries establish concrete reduction plans on their own by taking advantage of supporting tools. However, no such tool is provided by the GHG emission management systems in South Korea. In addition, the staff in charge of GHG emissions find it difficult to run the program because of a lack of experts, management challenges, and frequent staff turnover.
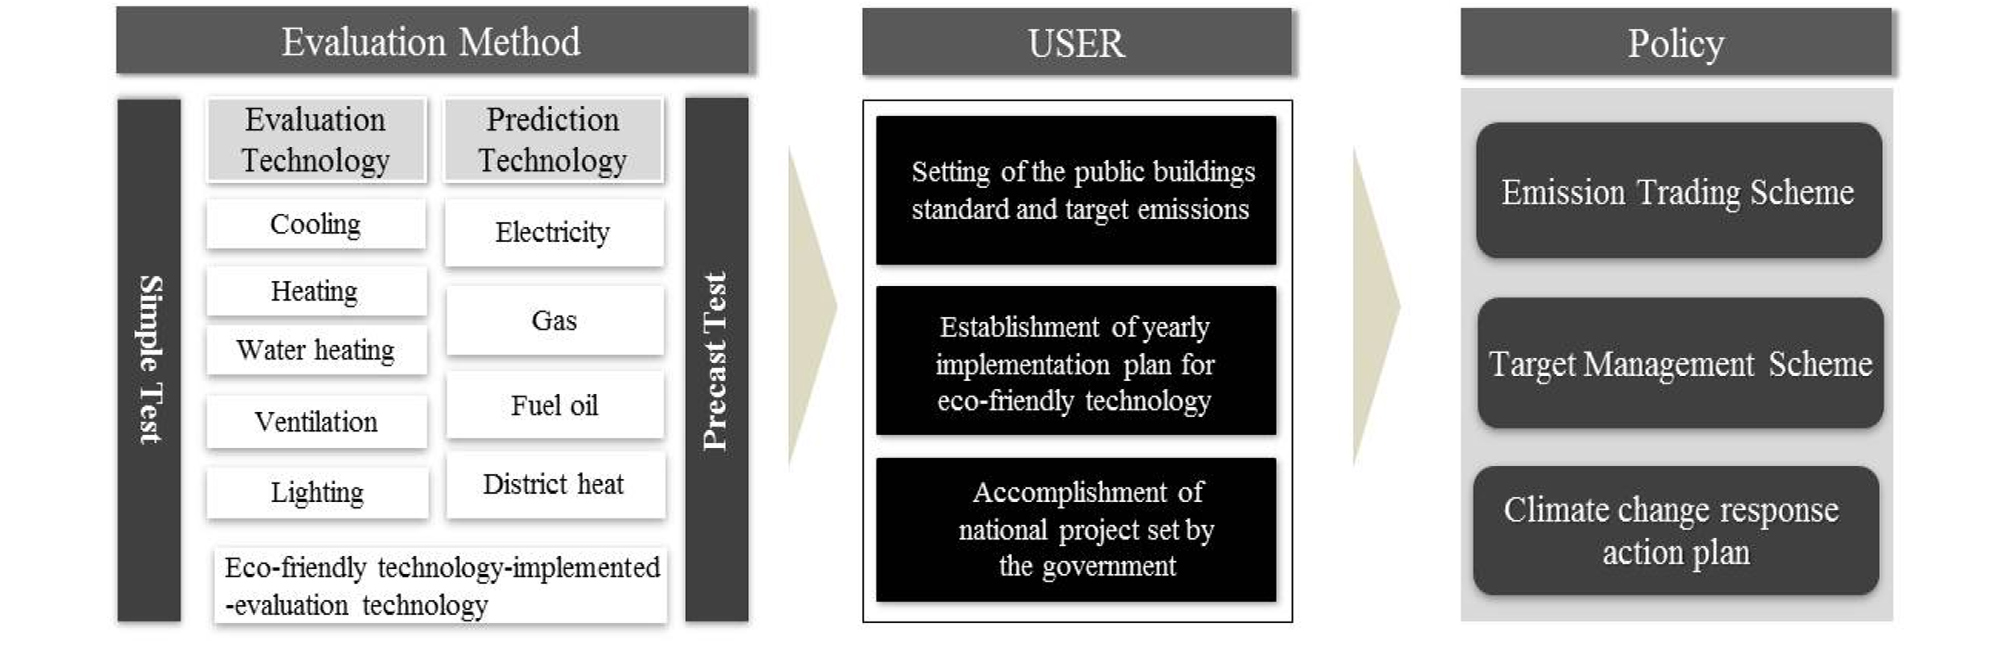
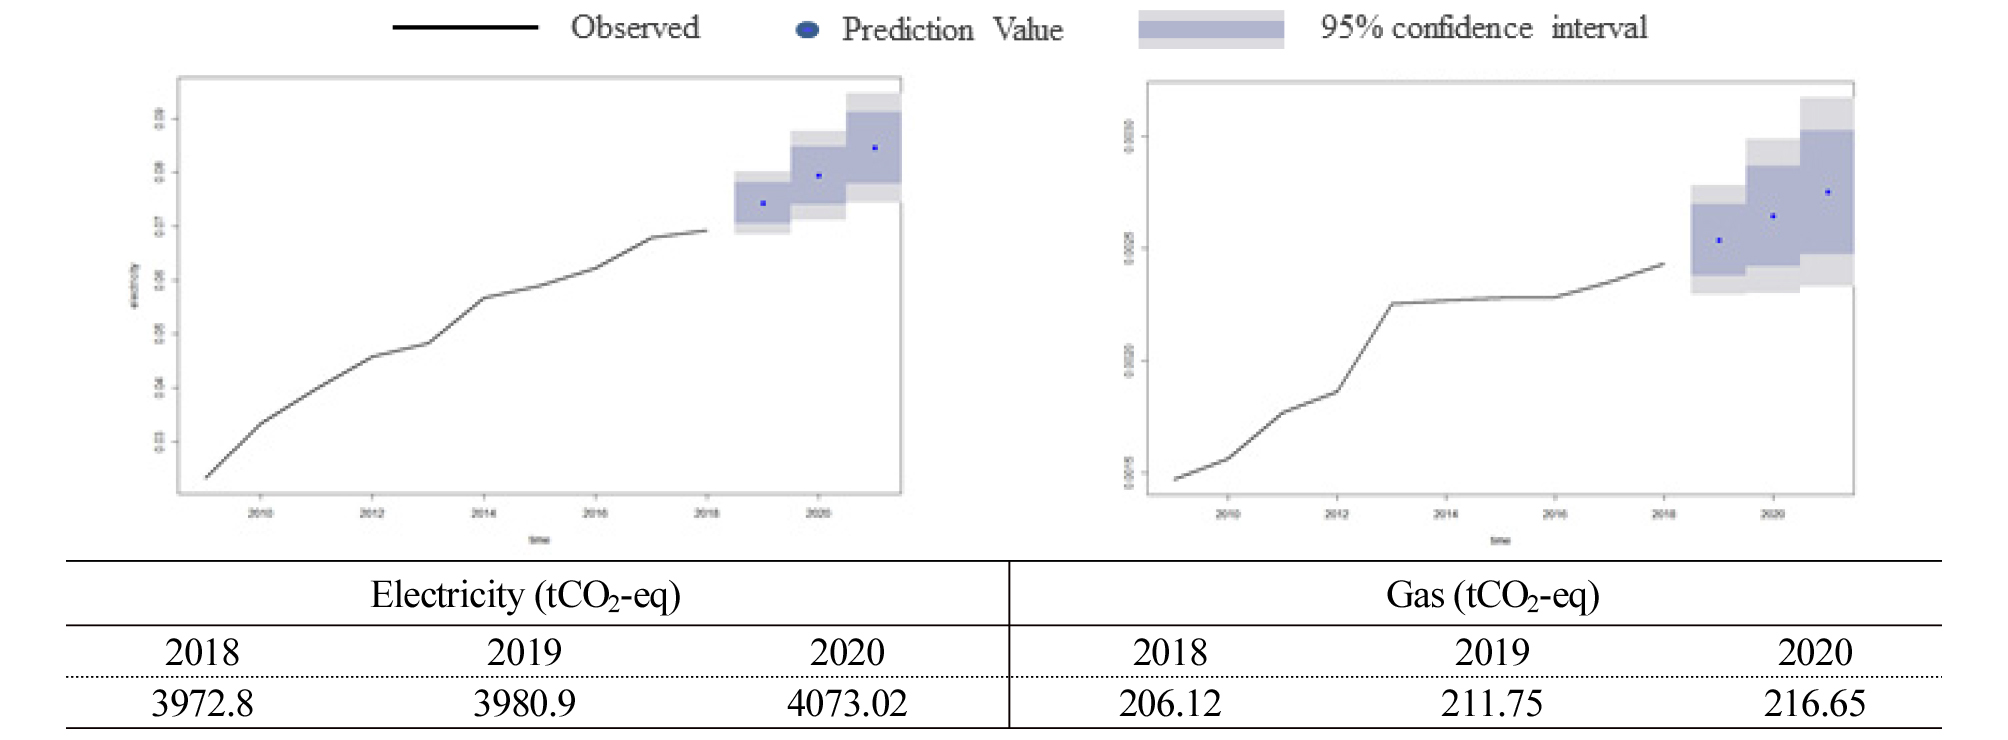
This study aimed to develop a GHG emissions evaluation tool that used minimal data and presented methods for the use of the system along with evaluation to support South Korea’s GHG emissions management system for public buildings. To achieve these goals, the authors created a GHG emissions evaluation DB by energy source and purpose of energy use (Figure 1). Moreover, users were guided in setting their emission quotas and GHG emission targets under government schemes like ETS and TMS. The DB allowed users to predict GHG emissions by energy source, such as electricity or gas and set emissions targets or quota. Furthermore, to meet emissions targets or emissions, the users could evaluate emissions by energy end use, such as cooling, heating, water heating, ventilation, and lighting and decide on how to cut GHG emissions. It is also expected that the users will be able to establish GHG reduction plans that consider future building technologies and improve user behavior on the basis of GHG emissions analysis and projection.
Survey to Identify the Direction of Evaluation
Public institutions in South Korea have been managing annual emissions targets since 2011 under the TMS. As of 2019, 826 public institutions have participated in this scheme, wherein they are required to submit both action plans and impact reports. In an attempt to identify the trajectory of GHG emissions evaluation tools for public buildings, the authors surveyed personnel in charge of the TMS task. A total of 83 public institutions participated in this survey, and the questionnaires were categorized into three parts related to the following topics: system understanding by the staff in charge of the task; general information from respondents, such as task experience, task difficulty, and satisfaction in running the system; and practical functions required in managing staff.
Table 3 shows the survey items and results. In the work experience item that was intended to evaluate the proficiency of the person in charge of the task, the turnover cycle was one year in 73% of the total agencies, and cases where the manager's work experience was less than one year or where they had no applicable work experience amounted to 86% of the total respondents. GHG-related work requires considerable expertise compared to other tasks in public agencies. However, the survey found that most public institutions did not have actual GHG reduction management and monitoring in place due to the frequent staff turnover and task delegation to non-specialists.
Table 3.
Survey items and results
In this study, 85% of respondents answered that they intended to use the policy support system. For system functions, 53% of the respondents required optimal emissions target estimation, 22% required the preparation of guidelines for the achievement of the emissions targets, and 28% mentioned reduction scenario and cost efficiency analysis.
In the survey items on task difficulty and system satisfaction, the Likert scale(psychological test response scale) was used for analysis and the results were converted to give scores out of a total of 100 points (Table 4) [17].
Table 4.
Calculation of task difficulty and system satisfaction
The Likert scale was set for 5 points. When converted into 100 points, the task difficulty satisfaction was very low at 33 points, and the system operation satisfaction was also very low at 39 points. Officials responsible for GHG emissions evaluation in public institutions, including the TMS or the ETS in the public sector showed dissatisfaction with the implementation of the system or scheme. They may have been dissatisfied with the difficulty in estimating GHG emissions, which requires a relatively high level of expertise, as well as with the setting of emissions targets, that did not consider public buildings’ individual characteristics.
To successfully operate a public-sector GHG management system, the aforementioned system and job satisfaction should be improved through the provision of support systems as well as through regulations regarding the qualifications of the personnel in charge of system-related operations.
To satisfy the requirements of public sector personnel operating the system, it is necessary to develop a GHG evaluation database for public buildings that is accurate, has a simple evaluation method, and provides tools for correctly interpreting the results.
Material and Methodology
The most basic matters related to evaluating GHGs are quantitatively grasping the future GHG emissions from the past, preparing reduction plans and implementation plans based on emission forecasts, and establishing reasonable reduction targets and efforts to achieve them.
Greenhouse gas emissions assessment currently has a top-down approach that focuses on macroeconomic conditions and industry-related effects, and a bottom-up approach to derive the potential for economic reduction from adoptable energy technologies and policy measures.
The bottom-up model is an approach that analyzes the effects of technology, social change, and policies on these variables by detailing the technologies related to the type of individual energy use. It is useful for analyzing the impact of the means.
In addition, it is possible to analyze the potential amount of greenhouse gas reduction reflecting various dynamic factors such as detailed description of the bottom-up model, technology development, adoption, and replacement phenomenon.
Since various production factors such as capital, labor, land, and energy are considered more comprehensively and alternative constraints between factors are explicitly considered, GHG reduction results in changes in output of various goods and, accordingly, a decrease in household welfare, resulting in a bottom-up model. Compared to this, the reduction cost tends to be high.
The analysis of the potential for GHG reduction mainly used at home and abroad and the forecast for energy demand mainly include the Computable general equilibrium model (CGE), Times, MARKAL, LEAP, and MESSAGE models. At the national level, major developed countries abroad are building various greenhouse gas analysis models, including the energy conversion sector, industry sector, and transportation sector. In the United States, the MARKAL model based on the optimal linear planning method and the scenario analysis type LEAP model are typical, and in Japan, the self-developed AIM model is built.
In Japan, AIM models that combine top-down and top-down models were developed and used for analysis. In the UK, it was found that the MARKAL model was basically used for analysis, and the top-down model results were referred to. Long-range energy alternatives planning system (LEAP) is a scenario analysis greenhouse gas modeling software developed by the Stockholm Environment Institute that can structure, analyze, and schematize energy consumption, production, and resource collection flows in all industries and economies.
The message model is used by international organizations such as the IPCC World Energy Council as a long-term energy optimization model. AIM is an optimization model that considers Asian characteristics and is used for scenario analysis in 12 countries in Asia. As described above, in developed countries, existing models such as Message, MARKAL, LEAP, and AIM were analyzed in a complex or single use to build a greenhouse gas reduction model.
In particular, in the case of buildings, it exhibits only high cost and high reduction effect, and has a problem that results in insufficient reality compared to other industries. In this study, we intend to build an evaluation DB that enables quantitative evaluation of buildings to establish a greenhouse gas reduction plan for a single domestic building by using energy use data based on actual energy consumption.
GHG Evaluation DB of Energy end use
Pre-inspection of energy end use allows us to monitor energy consumption and establish a plan for achieving GHG reduction goals. A simulation methodology is generally used to evaluate GHG emissions by end use, but the necessary level of use and influencing factors need to be analyzed by utilizing specific information for energy saving.
Table 5 shows a survey of energy consumption in public buildings in various countries. The survey was analyzed in order to construct an evaluation database of GHG emissions from public buildings by end use. Major developed countries including the USA and EU have recognized the importance of building energy consumption data and have been continuously developing databases on building energy consumption and relevant tools. Typical examples outside Korea include CBECS and the UK BEES (Building Energy Efficiency Survey) [18].
Table 5.
Survey of energy consumption in public buildings by country
Korea does not distinguish between public and commercial buildings and discloses energy consumption data according to usage of the aggregate energy and energy sources. However, the classification criteria between public and commercial buildings are not clear and the given data cannot be used as basic data. Moreover, the energy consumption by building type is not publicly available so it was difficult to use this as basic data for constructing the evaluation DB for this study. On the other hand, the US, UK, and Canada conduct surveys of both commercial and public buildings and provide raw data on the amount of energy used per building type and energy source.
An estimated 5.6 million commercial buildings existed in the United States in 2012 according to the CBECS. Environmental performance information on 256,000 commercial and public buildings were collected. This information included building type, materials, number of workers, climate, equipment, maintenance, and the amount and cost of energy used in the building. CBECS interviewers collect building characteristics and energy usage data (consumption and costs) from a respondent at the building. If the building respondent cannot supply the required energy usage data during the interview, they give their energy provider's name and account numbers instead. The U.S. Energy Information Administration (EIA) makes a follow-up survey of the energy providers for buildings without accurate energy data from the Buildings Survey. They contact providers of electricity, natural gas, heating oil (which includes fuel oil, kerosene, and diesel), and district heat (steam or hot water) to collect the needed energy usage data. The energy data are collected using a secure website that offers several reporting options designed to minimize reporting burden.
The EIA uses a probability sample to represent the entire population. To select a statistically valid sample that produces accurate statistics about the commercial building population, each building must have one and only one chance (probability) of selection, and the probability must be known. Most of this sampling frame is called the area frame portion, which is composed of all commercial and public buildings in selected geographic areas. In each selected geographical area, trained staff recorded information about every commercial building, either in person, by walking or driving across the entire selected areas, or virtually, using a Geographic Information Systems (GIS) web-based tool [19].
The evaluation DB of this study was limited to public buildings and countries with similar climates as Korea; a total of 225 buildings completed after 1970 were selected. The energy end use was categorized into 5 uses: space heating, cooling, water heating, lighting, and ventilation [20].
A GHG intensity DB by end use was constructed to measure building energy consumption and to support achievement of the GHG reduction goal. To build the DB, the commercial and public buildings energy consumption survey published by DOE in 2012 was used. Public buildings are classified according to the building registry regulated by the Korean Building Code, which includes categories for office facilities, educational facilities, research facilities, and health care facilities, and the energy consumption data of these buildings were selected.
In addition, the database was classified according to the year of completion in order to consider the efficiency of buildings. The classification reflected the age of the buildings by year as defined by the International Energy Agency (IEA). IEA is building energy statistics by grouping buildings with similar years of completion on a ten-year basis [21].
The GHG emission evaluation DB by energy end use in this study estimated GHG emissions by primary energy source (electricity, gas, oil, and district heating) by sorting similar qualities by building type and year of completion and dividing it by the gross area. During data pre-processing, data with greater than 10 % variance were removed [22]. The mean value, standard deviation, and percentile value were calculated using the R statistical program to capture the intensity distribution in the overall sample [23].
By using multiple regression analysis, a significance test on the intensity calculation data by year of completion and building function was conducted. The sampling design conducted in this study was to estimate projected GHG emissions by building type with a certain tolerance level, so average values were used, representing the intensity distribution. Table 6 shows the evaluation DB for GHG emissions by energy end use, calculated by applying the unit of intensity of the gross area of corresponding space, and Figure 2 shows the proportion of calculated intensity by end use.
Table 6.
GHG emissions evaluation intensity database by end use Unit: tCO2-eq/m2
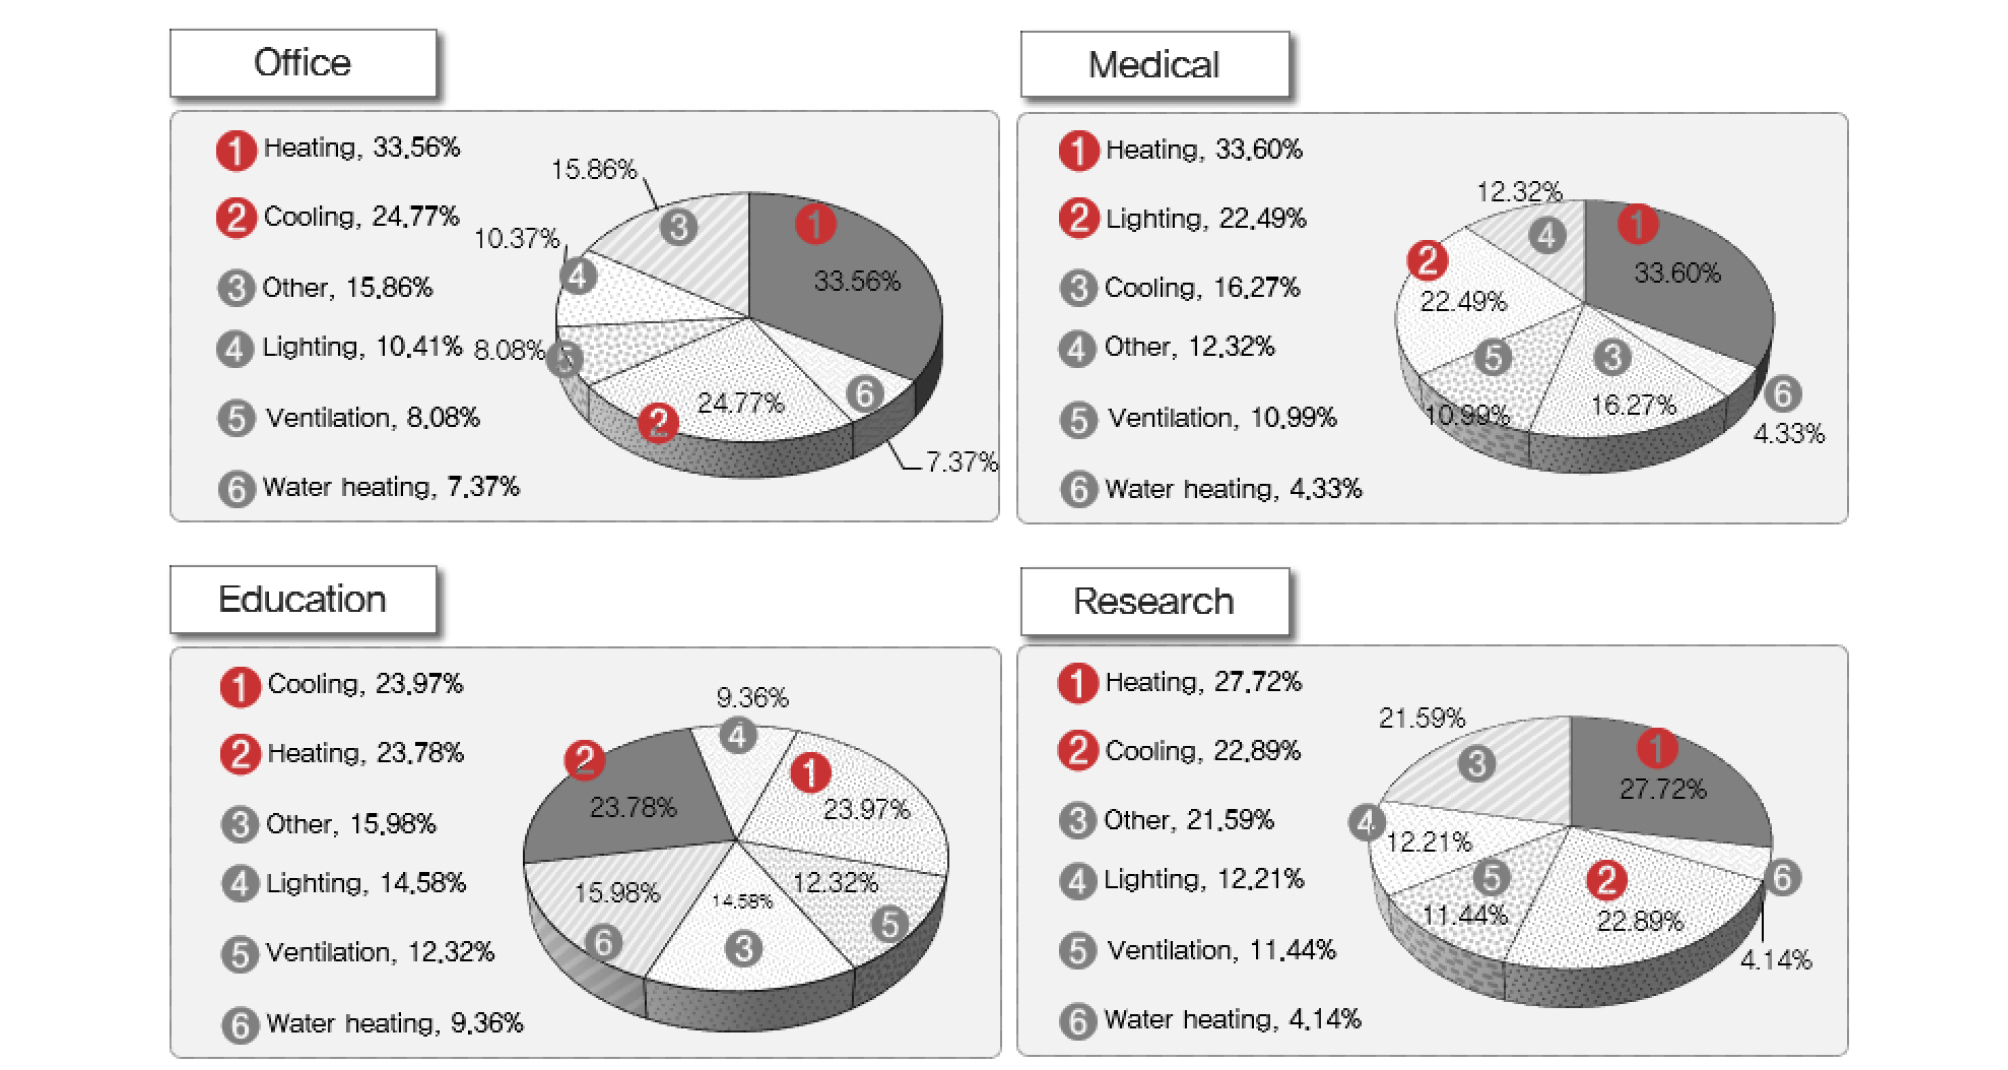
The reference proportions of office facilities in age group 4 were 33%, 24%, and 10% for heating, cooling, and lighting, respectively. As for heating and cooling, which change seasonally, the intensity was especially high. It was confirmed that the more recent the year of completion was, the lower the intensity. As for cooling, age group 4, when compared to age group 1, reduced by about 71.25%, and heating, ventilation, water heating, and lighting were 61%, %, 0.7%, 40.3%, and 26.73%, respectively, confirming that the intensity was reduced by 32.182% of the overall average.
Significance verification of the emissions DB by end use
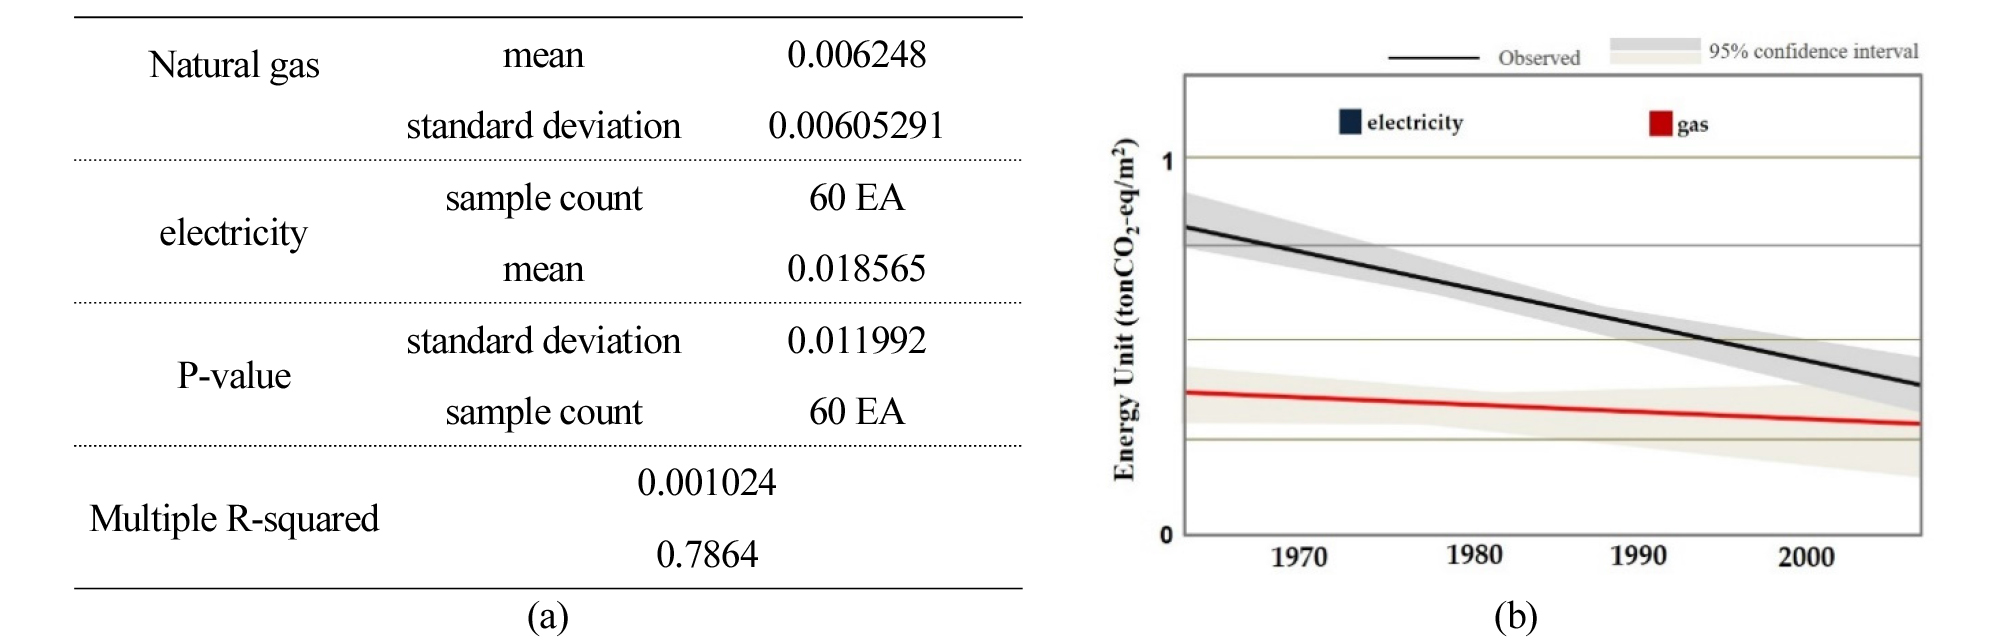
The energy intensity data by end use and floor area was established for buildings completed between 1970 to 2010. In addition, we verified the significance of the intensity DB through multiple regression analysis of the intensity by the construction year. For data pre-processing and analysis, various analysis models were provided and R was used to facilitate big data analysis. Figure 4 shows results of analysis by multiple linear regression of the constructed emissions DB by end use. Multiple R-squared was 0.7864 and the p-value was 0.001024, much smaller than 0.05. We determined that data of the buildings selected are statistically significant, and the earlier the building was constructed, the higher the intensity of estimated gas and electricity usage. In the case of gas, the slope was -34.304, confirming that it was decreasing. This is because buildings completed more recently had higher energy efficiency and the intensity was estimated to have smaller values. Similar to electricity, the result decreased according to the year of completion with a slope of –6.330, although this was not as low for gas(Figure 3).
Case Study
The significance of the DB for end use and energy source was examined by regression analysis and correlation analysis. In this study, we compared the GHG emissions evaluation results calculated from each DB based on the same evaluation object to analyze the validity of the evaluation DB. The building under evaluation is a reinforced concrete construction facility built in Seoul in 2011. Table 7 provides an overview of building to be evaluated.
Table 7.
Evaluation overview

In order to identify the validity of the DB for end use and energy source as well as to verify the validity of DB implementation in support of the public sector GHG evaluation system, GHG evaluation of the public building was conducted by dividing results of the evaluation DB by the results of the evaluation. In this case, a comparison of GHG emissions by end use was conducted using result values of corresponding buildings, and buildings were notified in advance.
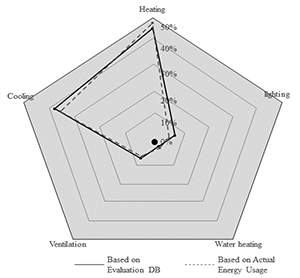
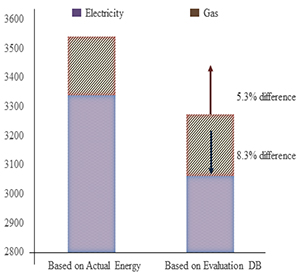
Table 8 shows the evaluation results of the case study. Evaluating buildings by end use by means of the GHG DB, the emissions for cooling, heating, water heating, ventilation and lighting were estimated to be 807.442 tCO2-eq, 956.825 tCO2-eq, 17.478 tCO2-eq, 123.774 tCO2-eq, and 141.486 tCO2-eq, respectively.
Table 8.
Validity analysis results
 |  |
| (a) Emissions analysis results by end use | (b) Emissions analysis results by energy source |
Evaluating buildings by end use by means of the actual energy usage, the emissions for cooling, heating, water heating, ventilation and lighting were estimated to be 738.632 tCO2-eq, 1026.893 tCO2-eq, 16.741 tCO2-eq, 130.275 tCO2-eq, and 150.643 tCO2-eq, respectively. The emission error by end use reviewed in comparison with actual energy consumption were 8.5%, 7.3%, 4.2%, 5.2% and 6.4%, respectively.
Conclusions
As a part of the development of an efficient greenhouse gas evaluation system for public buildings, this study was conducted to construct a database to enable the evaluation of GHG emissions using basic building information.
1.To examine the necessity of developing a greenhouse gas emission evaluation system for public buildings, we verified that such a system was necessary through a questionnaire survey of public agency officials in charge of this task as well as through overseas case studies.
2.To evaluate the greenhouse gas emissions of public buildings with minimal building information available, we developed a database for GHG emissions evaluation by end use.
3.To verify the significance of the greenhouse gas evaluation database, multiple regression analysis and correlation analysis were performed on the basic data, and the statistical significance of the results were verified.
4.Through the greenhouse gas evaluation database, we proposed a plan to utilize the evaluation database to allow the user to evaluate greenhouse gas emissions and support the system by setting target emissions and formulating climate change response action plans of the buildings.
5.The validity of the greenhouse gas evaluation DB showed that the evaluation results were very effective with an error rate lower than 8%.
