

Introduction
Model Configuration
Frame Models
The Isolation Unit
Ground motion selection and test input
Installation and Testing
Instrument Setup
Calculation of time period and damping of the models
Result and Discussions
Dynamic characterization of the models and earthquake waves
Response Spectrum analysis of the selected earthquake waves
The top floor accelerations of non-isolated and base-isolated models
Response reduction due to base isolation
Comparison between 8 storey metal and wooden structural model
Conclusions
Introduction
Earthquake, one of the most dreaded of all calamities that have scared the human civilization for ages. The calamity caused by the earthquakes to the poorly as well as well-constructed structures in the recent year has led to a massive loss of life and property. This has obligated the designers to think of alternative solutions and modern methods to protect the structures from earthquake forces (Patil et al., 2012) [1]. The response spectrum of the Gorkha earthquake, Nepal during 2015, obtained using Prism software clearly shows that there is a huge gap in peaks that were experienced during the earthquake and those prescribed by IS Code. Hence, in today’s time, it has become vital to implement preventive measures to thwart the effects of ever-increasing earthquake incidences. Preventive measures involve engineering interposition in structures to make them resilient enough to endure the impact of probable earthquakes (Arya, 2000) [2]. Isolation from the ground during the event of the earthquake has been one of the exciting subjects for researchers and is considered as a useful technique to reduce the seismic demand of the structures (Monafared et al., 2013) [3].
Base isolation is generally considered as a competent technique for reducing the inter-story drifts, shear forces, and floor accelerations of a base-isolated structure as compared with those of a conventional fixed-base structure. The main feature of base isolation technology is that it introduces flexibility at the base storey between the superstructure and the ground by providing a layer with low lateral stiffness between the structure and the foundation to decouple the structures from the horizontal components of the potentially hazardous earthquake ground motion chiefly in the frequency range where the building is most affected. The harmonious movement of the structural basement will cause a substantial decline in fundamental frequency that is much lower than its fixed-base frequency and also much lower than the principal frequencies of the ground motion which means that due to the induced flexibility, the time period of the fixed structure takes a jump and the new base-isolated structure has a new time period (Gomase et al., 2011) [4]. This allows for more concerted movement at the base and decreases the demands on the superstructure. To lessen this extensive movement at the base, energy absorbing isolators are usually designed by adding energy dissipation devices, adding more damping in the system (Chimamphant et al., 2016) [5].
Another method to reduce the displacement of a tall building due to laterally acting forces (wind or earthquake) is by the including a provision of a core structural system. The core is the main lateral force-resistant component. Schueller et al., (1986) [6] defines core as the central part of a multi-storey structure that assimilates functions and service needs for inhabitants. A core ties the building together to act as a single unit maximizing flexibility in the layout, carries gravity loads and provides lateral load resistance (wind and earthquake). The core is used in the form of shear wall systems to provide the necessary lateral stability for the building. Choosing a competent structural system is vital to having an effective tall structure. Generally, the taller the structure, more substantial is the horizontal load. This demand also upsurges with the rise in slenderness and flexibility. Fazil Ali K (2014)[7] showed the effective reduction in response during analysis of RC framed structure using base isolation techniques with elastomeric bearing and comparing the seismic response in terms of acceleration, velocity and displacement of normal and base-isolated structure from the results obtained in ETabs software. Sabu et al., (2014) [8] carried out linear static and nonlinear dynamic analysis on non-isolated and base isolated structures under code directed bi-directional earthquake in seismic zone V of India. The study shows the efficacy of the base isolation system in terms of reduced responses under earthquake loads. A study on a G+7 floors, shear wall residential tower structure was carried out by Salic et al (2008) [9] in order to elucidate the effect of lead-rubber bearings base isolation upon its seismic performance when subjected to 4 different real-earthquake excitations define and compare nonlinear responses of fixed-base and base isolated structures. The results showed a considerable elongation of the fundamental natural time period & reduction of interstorey drifts to a negligible level, floor accelerations and base shear of isolated structure in comparison to the fixed-base structure. Gomase et al., (2011)[4] investigated the response of a 4 multi-storey structures with high damping rubber bearing subjected to realistic earthquake time histories of Elcentro, Kobe and Northridge earthquakes. The isolation systems were designed according to UBC97 & a non-linear time history analysis was carried out using SAP2000. The outcomes clearly showed that the UBC97 provisions could successfully predict the isolator displacements and the acceleration and interstorey drifts of the base disengaged model were considerably decreased in comparison to its fixed base model.
Patil et al., (2012)[1] provided an outline of the existing situation of base disengagement methods with distinctive importance and a brief on other methods established in other parts of the world for extenuating seismic forces on the buildings. The discussion is presented on the impacts of using base separation on buildings located on soft soils and near active faults, it gives insights into using natural base isolation on naturally offered soil conditions. They portrayed base isolation method as an effective protection and resisting mechanism against a seismic activity which is gaining continuous recognition through the last two decades by providing a flexible base that decouples the structure from the ground motion and reduces the structural responses. Yabana et al., (2000)[10] developed thick rubber layered bearings to be used for 3-D base isolation system with design parameters calculated to efficiently decrease both horizontal and vertical seismic loadings. Static, dynamic and failure tests were carried out on scaled prototypes of bearings to evaluate the mechanical characteristics and the performance of the rubber bearing. Brunesi et al., (2018)[11] carried out an assessment of the seismic response of a multi-storey 36 storey frame with outriggers and belt trusses using nonlinear dynamic finite element analysis. The work depicted that with precise designs, comprehensive capacity design principles and performance-based seismic design theories, the outrigger system provided an optimal combination of stiffness and strength to the structure. An outline of modelling methodologies fitting to record the structural responses of both slender and stout RC walls and link beams was provided by Wallace (2000)[12]. The outcomes were equated with experimental results to judge the capability of usual modelling methods to correctly forecast both global and local experimental responses. Anshuman et al., (2000)[13] carried out a study on an answer, to the location of the shear wall in multi-storey buildings. A fifteen storied building located in zone IV was subjected to a calculated earthquake load. It was witnessed that the top floor deflection was reduced and was found to be within the permissible deflection when the shear wall was provided.MohiUd Din et al., (2017) [14] compared the structures fitted with core and without it based on linear and non-linear static analysis of two model frames. In this research, a rigid concrete core was used instead of the shear wall, and the displacement was evaluated by default procedure. It was found that the provided core system was effective in reducing lateral displacement and limiting the development of the plastic hinges at the primary phases.
Model Configuration
Frame Models
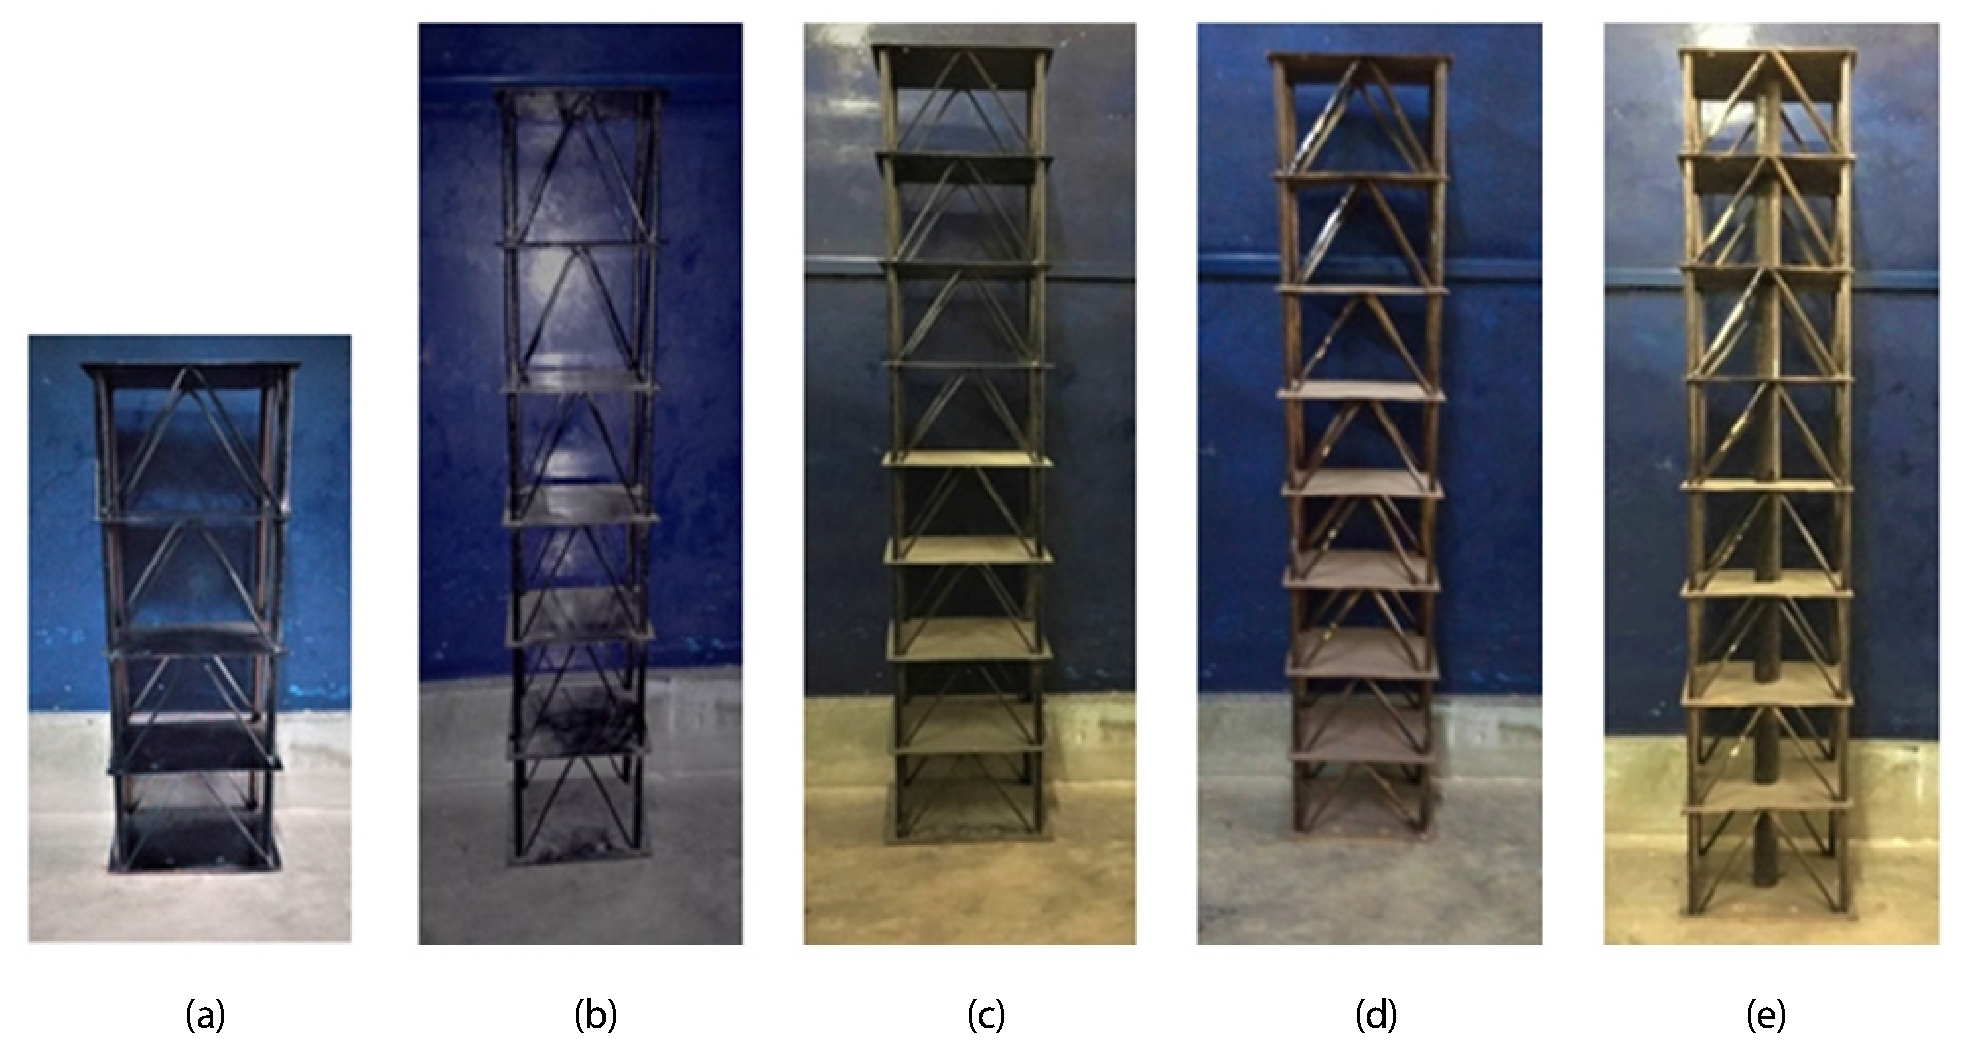
Metal iron has been used as the material for 3 models and 2 models were made using wood. The iron plates used in the models are of a 1 mm thickness as rigid diaphragms and the structure is erected by welding. The study involves 4 storeys, 6 storeys and 8 storeys metal iron-framed structure model having the same plan dimensions for all the models which are 190 mm X 160 mm. The height varies from 500 mm for 4 storeys, 750 mm for 6 storeys and 1000 mm 8 storeys models respectively. The 8 storey wood framed structure with a solid core was modelled having length, breadth, and height of 190 mm, 160 mm and 1000 mm respectively and a 35 mm dia. wooden cylinder inserted in the centre throughout its height to represent the core in an actual structure. Inverted V-Chevron bracing is provided for additional lateral load resistance. Shake table dimensions are 506 x 380 x 22 mm (l* b* t) and weight is around 11.5 kg. The dimensions of the model are taken from the prototype of the earthquake shake table as it represents the real building scenario. The constructed models are shown in Figure 1 below.
The Isolation Unit
To make the base isolation unit, metal iron plates of 1 mm and neoprene rubber sheathing of 8 mm thickness were used to absorb the shocks. The base-isolation unit is about 50 mm wide with metal iron sheets sandwiched between them. The isolation unit is an independent/detachable unit which can be attached to any of the prepared framed structural models. The isolation unit is shown in Figure 2.

Ground motion selection and test input
Spectrum matching accelerograms of five waveforms of different earthquakes were employed in the test. The acceleration time history of the Elcentro 1940 with a magnitude of 6.9 Mw, epicentre of the earthquake was 70 km from the ground surface and the time histories of four different stations in Gorkha, Nepal with a magnitude 7.8 Mw with the epicentre 80 km North-West of Kathmandu were selected in the present study. The details of these earthquake inputs used are given in Table 1.
Table 1. Details of earthquake excitations used in the study
Installation and Testing
Instrument Setup
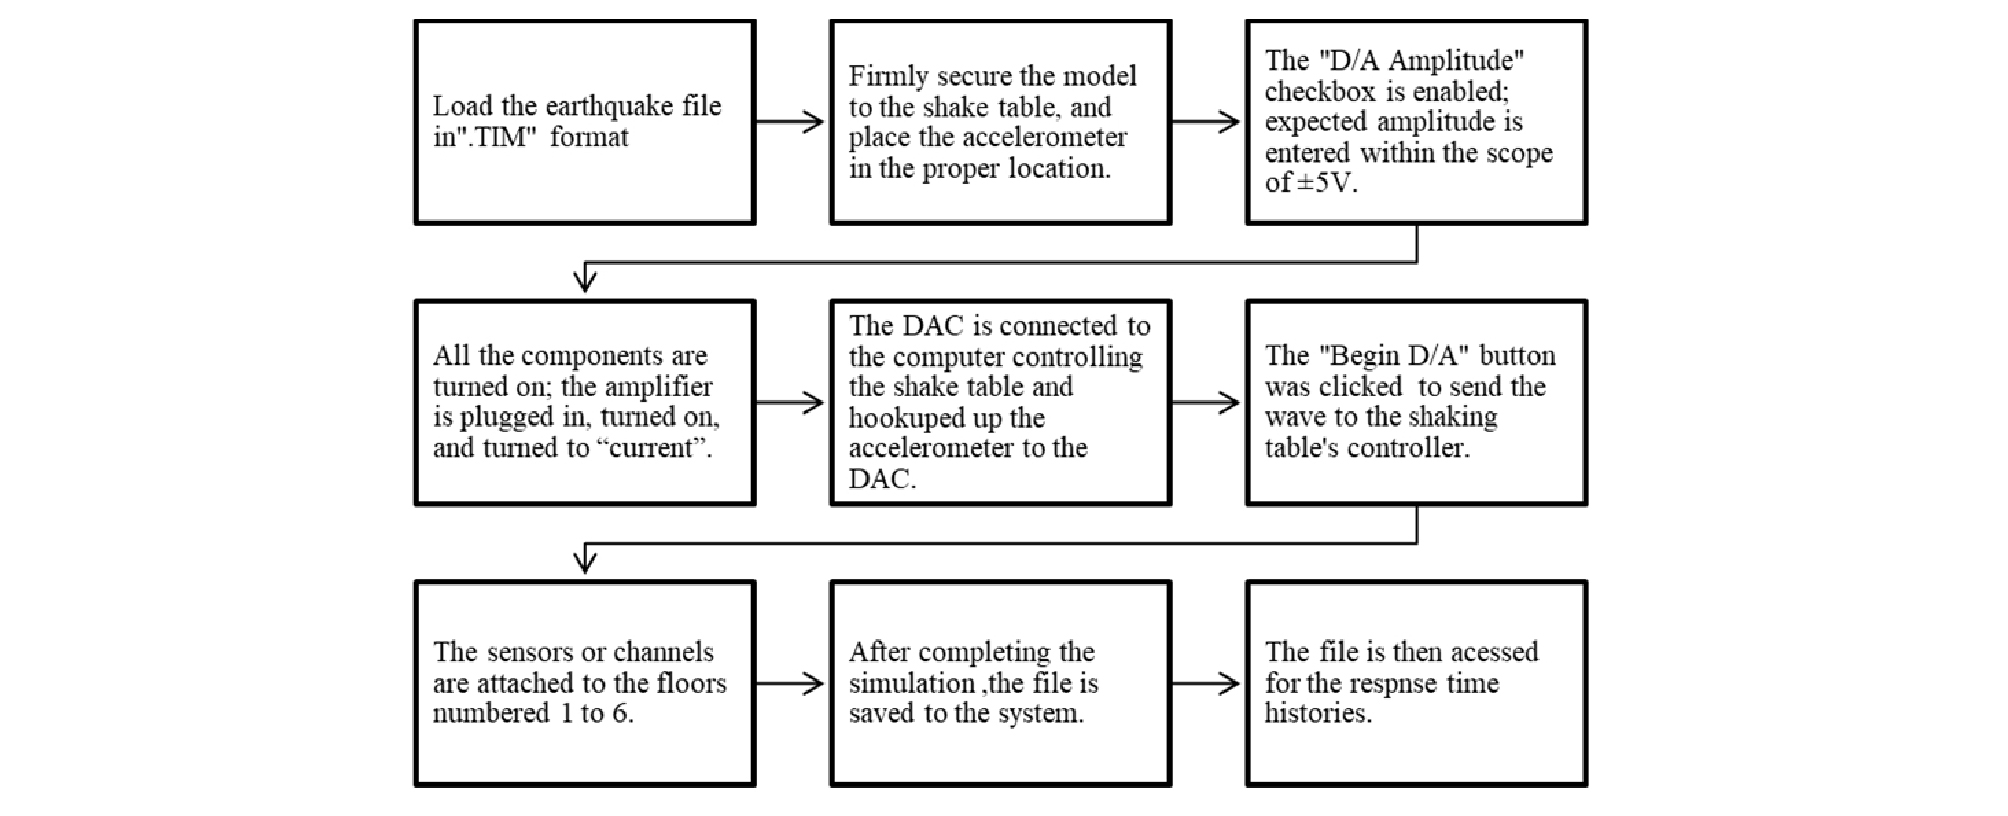
Four 8 mm diameter holes were drilled in the model base to attach it to the shake table. For the base isolated models, the base isolator was sandwiched between the model base and the shake table platform. The steps involved are shown in the Figure 3 below.
Calculation of time period and damping of the models
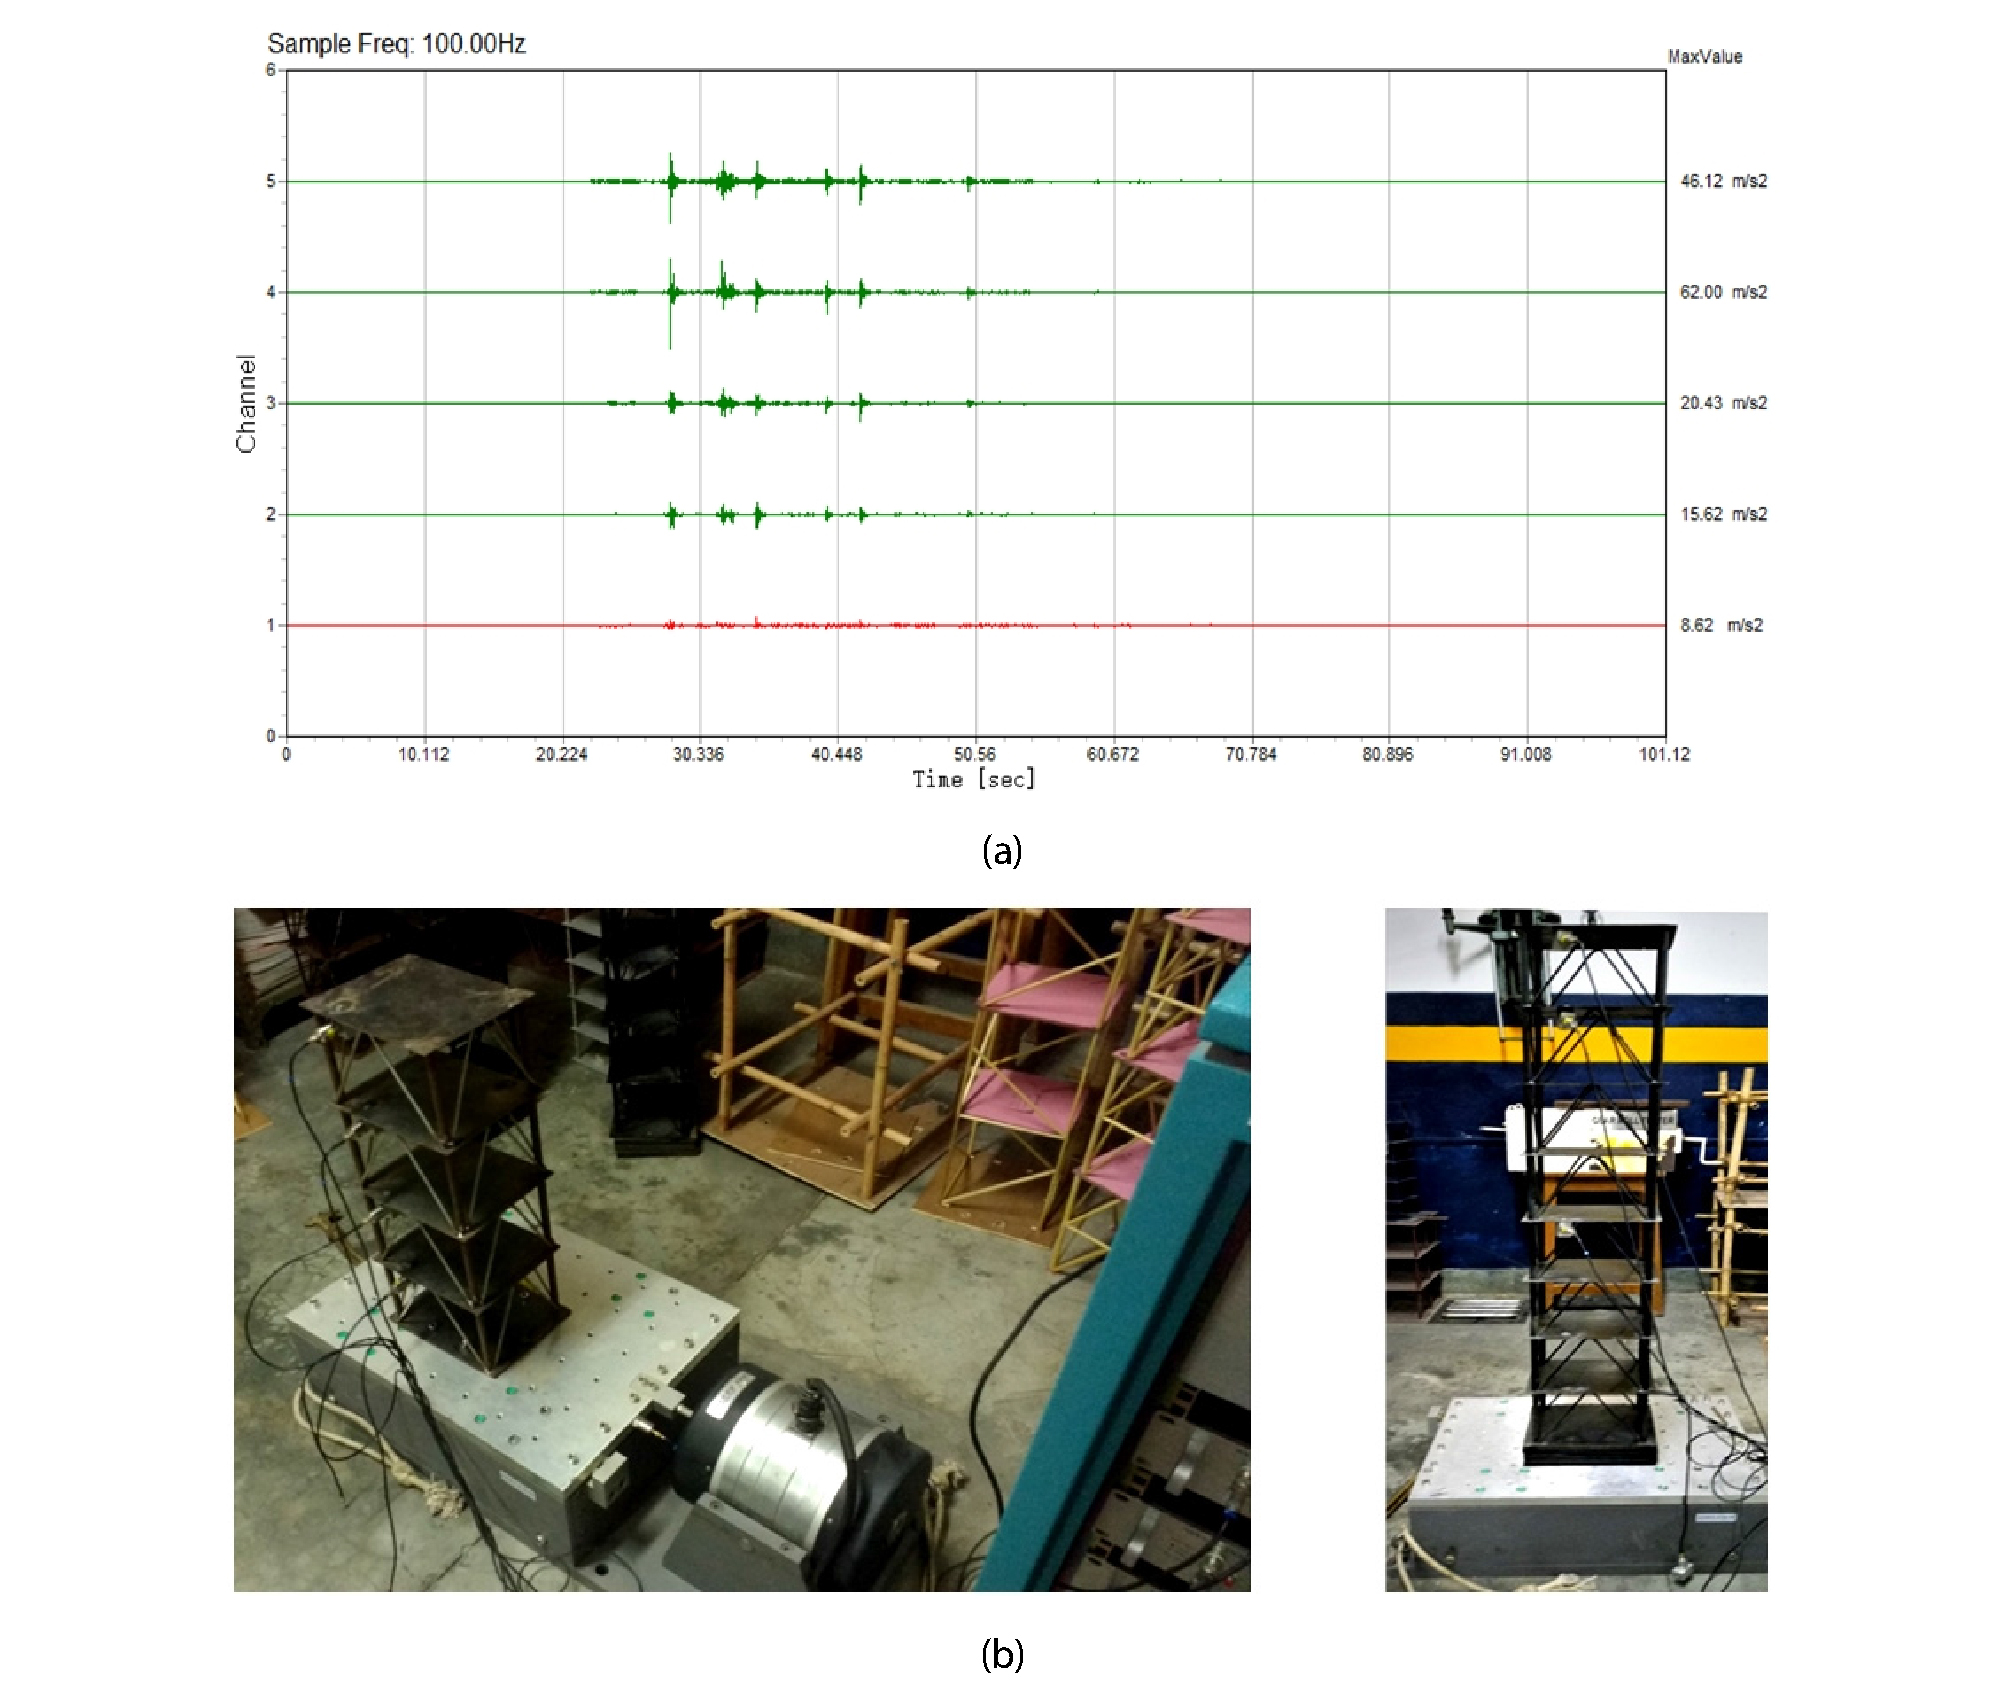
The time period of all the models and their respective damping values were found by exciting all the non-isolated models by a sine wave for 20 seconds each. Using the results obtained from the sine wave excitation, spectrum analysis was performed in Vib’SYS software. This provided us with the frequency range, natural frequency and maximum response Rd required to calculated damping using Half Power Bandwidth method. The obtained natural frequencies, time period and respective damping values are represented in Table 2. The output acceleration time history is obtained as shown below in Figure 4 for one case; 4 storeys non-isolated.
Table 2. Fundamental Time period, frequency and Damping of models
| Storeys / Structural system | 4 | 6 | 8 | 8 wooden | 8 Core |
| (rad/sec) | 168.65 | 80.13 | 61.33 | 61.33 | 61.33 |
| Time period (s) | 0.037 | 0.078 | 0.102 | 0.102 | 0.102 |
| Damping () (%) | 3.91 | 3.16 | 6.15 | 9.02 | 16.8 |
Result and Discussions
Dynamic characterization of the models and earthquake waves
The time periods, fundamental frequencies and the damping ratios of all the model frames have been found out using Half-Power Bandwidth method and are given in Table 2.
The model with the least height is observed to have the least time period and the highest value of natural frequency signifying high rigidity and stiffness of the structure. For the 6-storey structure with height 750 mm, it is observed that the natural frequency is reduced compared to the 500 mm model and the higher time period signifying a relatively flexible structure. All the other 1000 mm structures are found to have the same natural frequencies and time periods. From this observation, a conclusive statement can be made that, as the height of the structure model is increased, the respective natural frequencies have decreased, which reinstates a decrease in stiffness of the structure. But, the damping ratio was found to increase with the height of the models. An interesting observation was that even for models with the same height, time period and angular frequency the damping ratio increased when the material was changed from iron to wood and even when the core was introduced.
Response Spectrum analysis of the selected earthquake waves
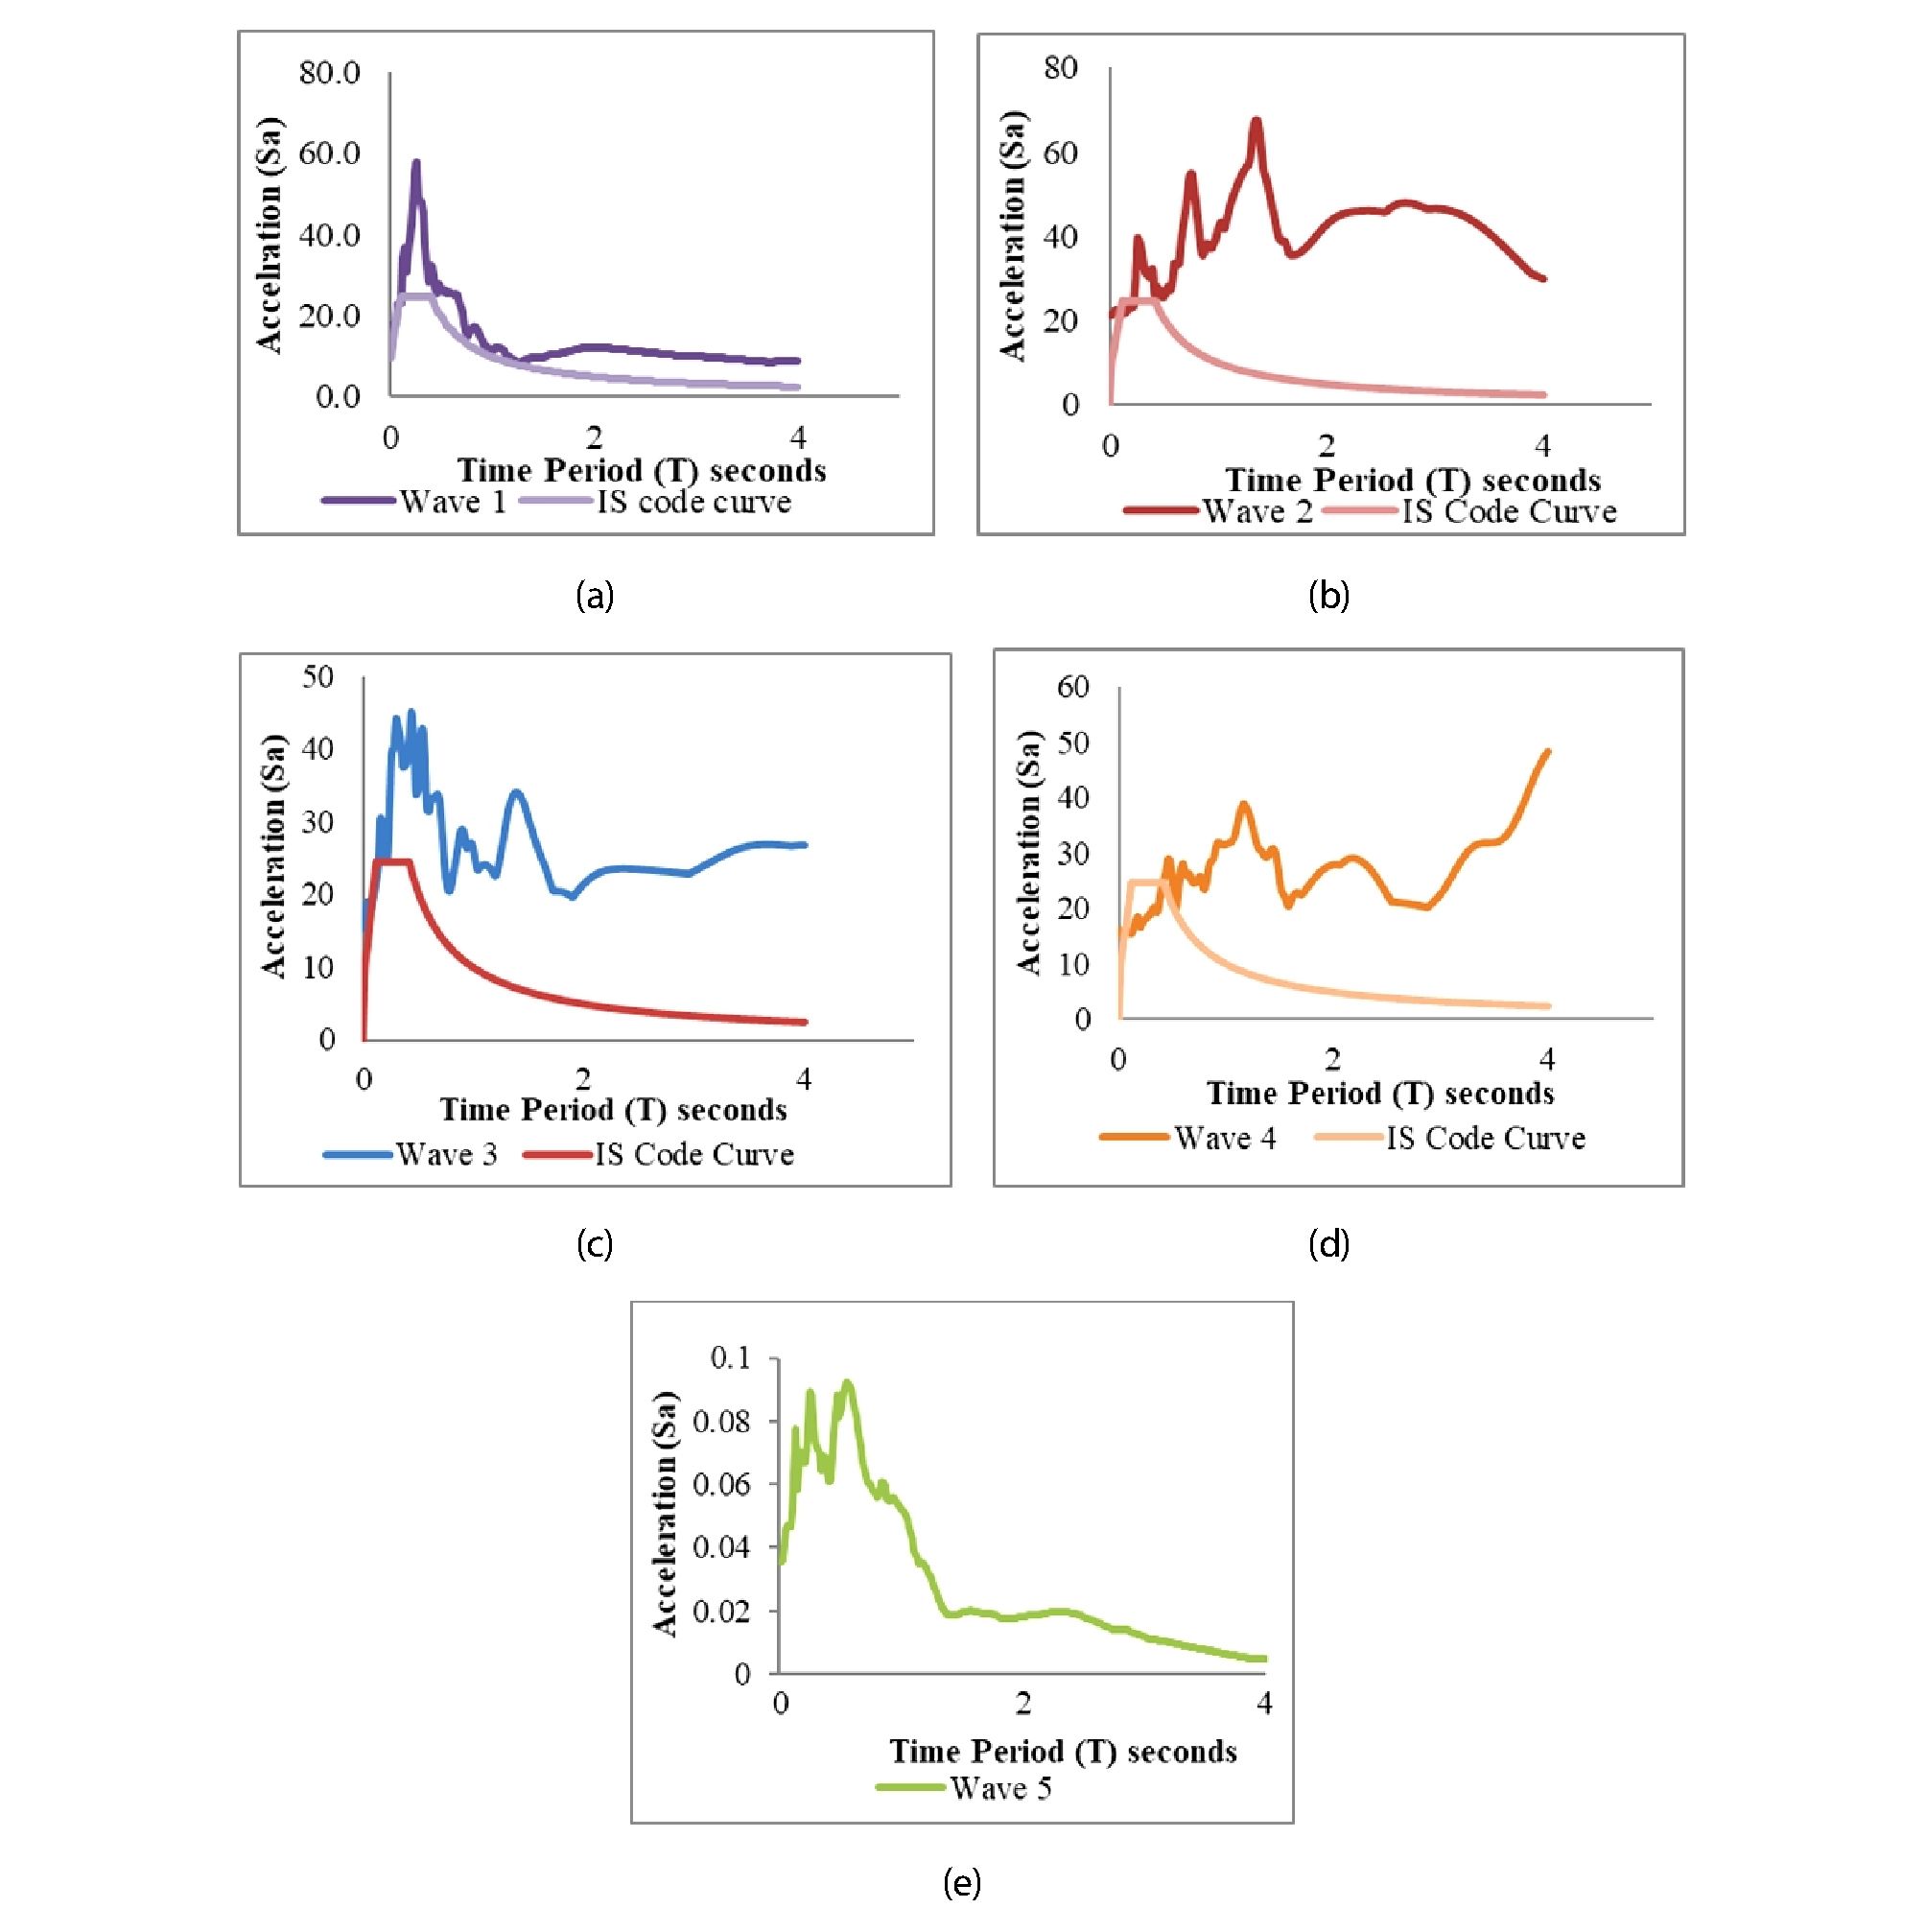
The earthquake data for all the five waves were used to obtain the response spectrum using Prism software.
Figure 5 shows the respective response spectrums for all these waves. From the response spectrum plot, we can infer that wave 1 and 5 have their peaks occurring inbetween 0.3-0.6 seconds, implying that they are both small wave earthquakes and are likely to excite the short period structures. Similarly, the response spectrum shows that wave 2, 3 and 4 are long period earthquakes likely to excite relatively longer period structures. From the response spectrum of waves 1 to 4, it is also evident that the max. acceleration value is much higher than that proposed by Indian Standard Design curve which necessitates detailed study on behavior the structures under such excitations and thereby the codes needs to be modified.
The top floor accelerations of non-isolated and base-isolated models
The acceleration and displacement responses of all the fixed base models obtained from the experiment are given in Table 3.
Table 3 and Table 4 represent the responses (acceleration and displacement) of the topmost floor of the structure without and with isolation provided at the base and subjected to the selected five earthquake waves. The discussion of these results is done in the following sections with the help of graphs in Figure 6.
Table 3. Top floor acceleration response of non-isolated models
Table 4. Top floor acceleration responses of base-isolated models
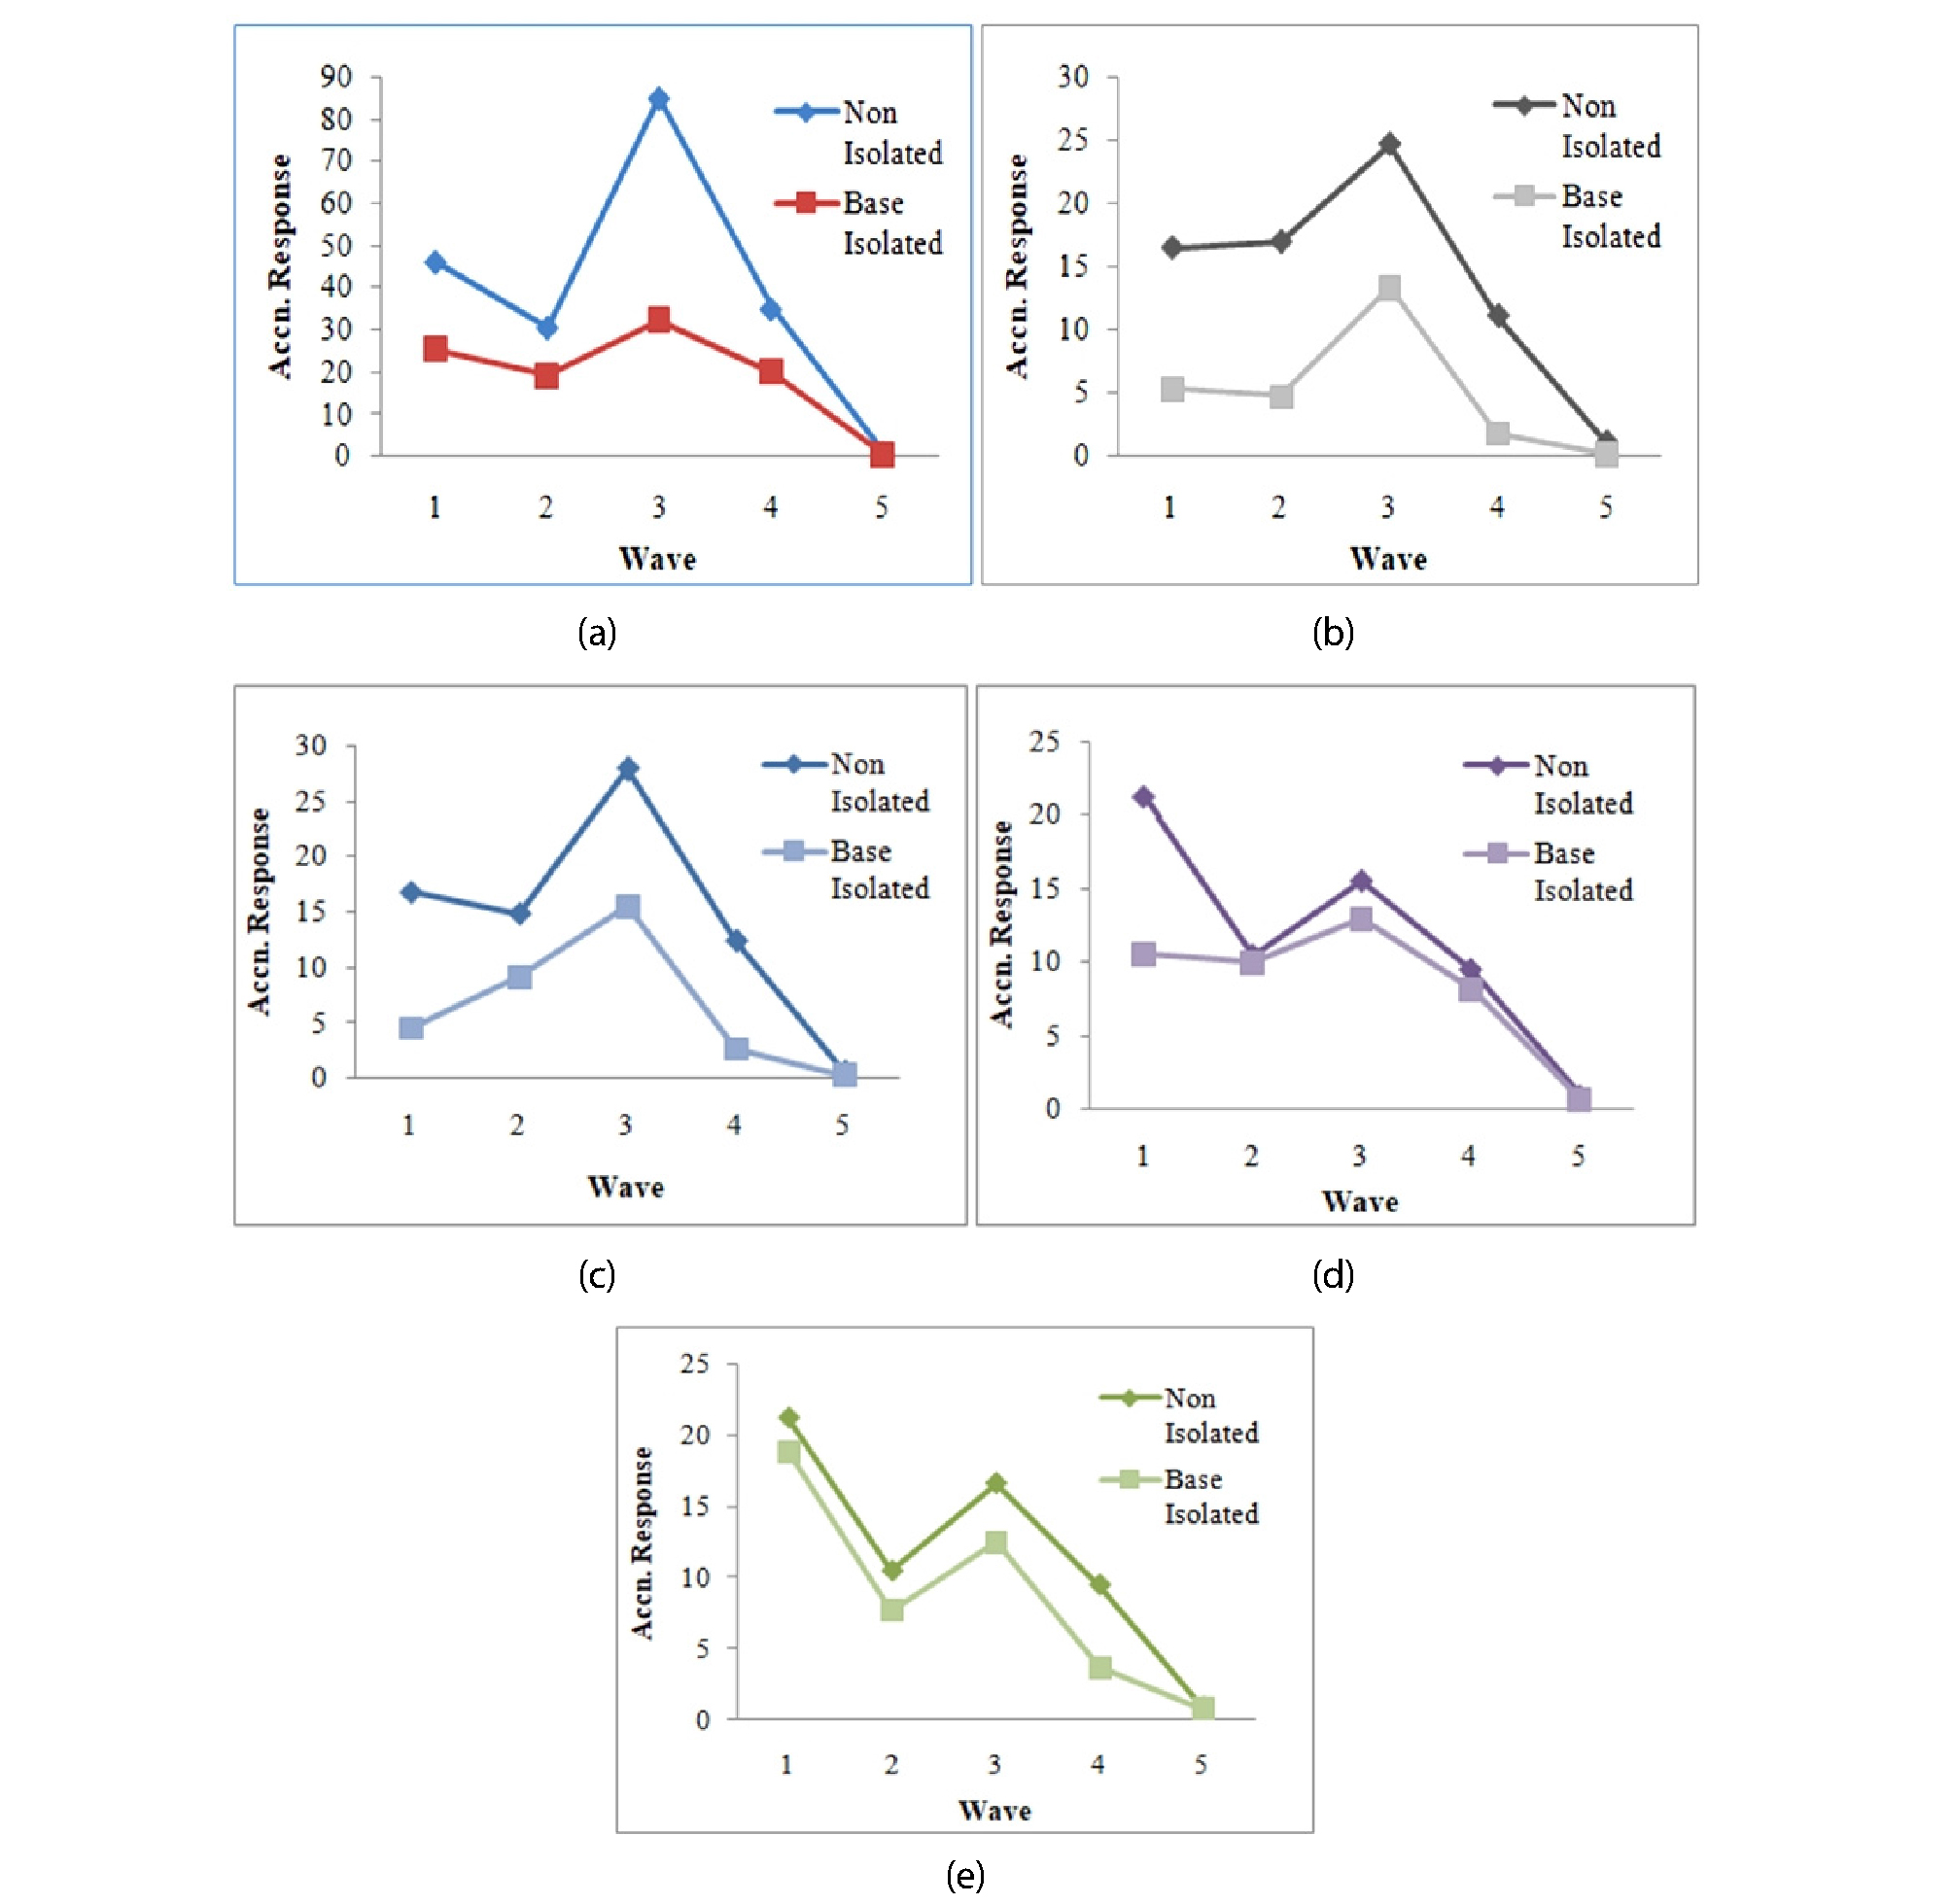
The data listed in the tables 3 and 4 indicate the adequate capacity of the proposed technologyin reducing the seismic demand on the structure. The comparative analysis for all the 5 waveson all three different sized non-isolated and base-isolated models show that the base-isolated model is far safer than the other. It can be inferred that the best results are shown forwave 1 and wave 4, which means that the structures having the same time period as the testedmodels will behave better under earthquake excitations similar to Wave 1 & 4.
Figure 6 highlights the comparative analysis of the top acceleration response of structures in a graphical form to understand the difference in both values i.e. with and without an isolation system. It is evident from the above figure that for wave 5 i.e. the elcentro earthquake excitation, the response reductions are relatively less in value and in some cases exceeding the value of the non-isolated model’s response. The probable reason behind this can be Elcentro earthquake i.e wave 5, is a short period earthquake wave and the highest components of ground acceleration is achieved in the range 0.5 to 0.6. And it was observed that maximum response was transmitted in all the models excited by Elcentro earthquake, thus, reducing the effect of base isolation. This improvement in base isolation framed model shows that the building absorbs the shock energy by dissipating the shock waves in a manner that it resists deformation and thus avoids damage on both biotic and abiotic levels.
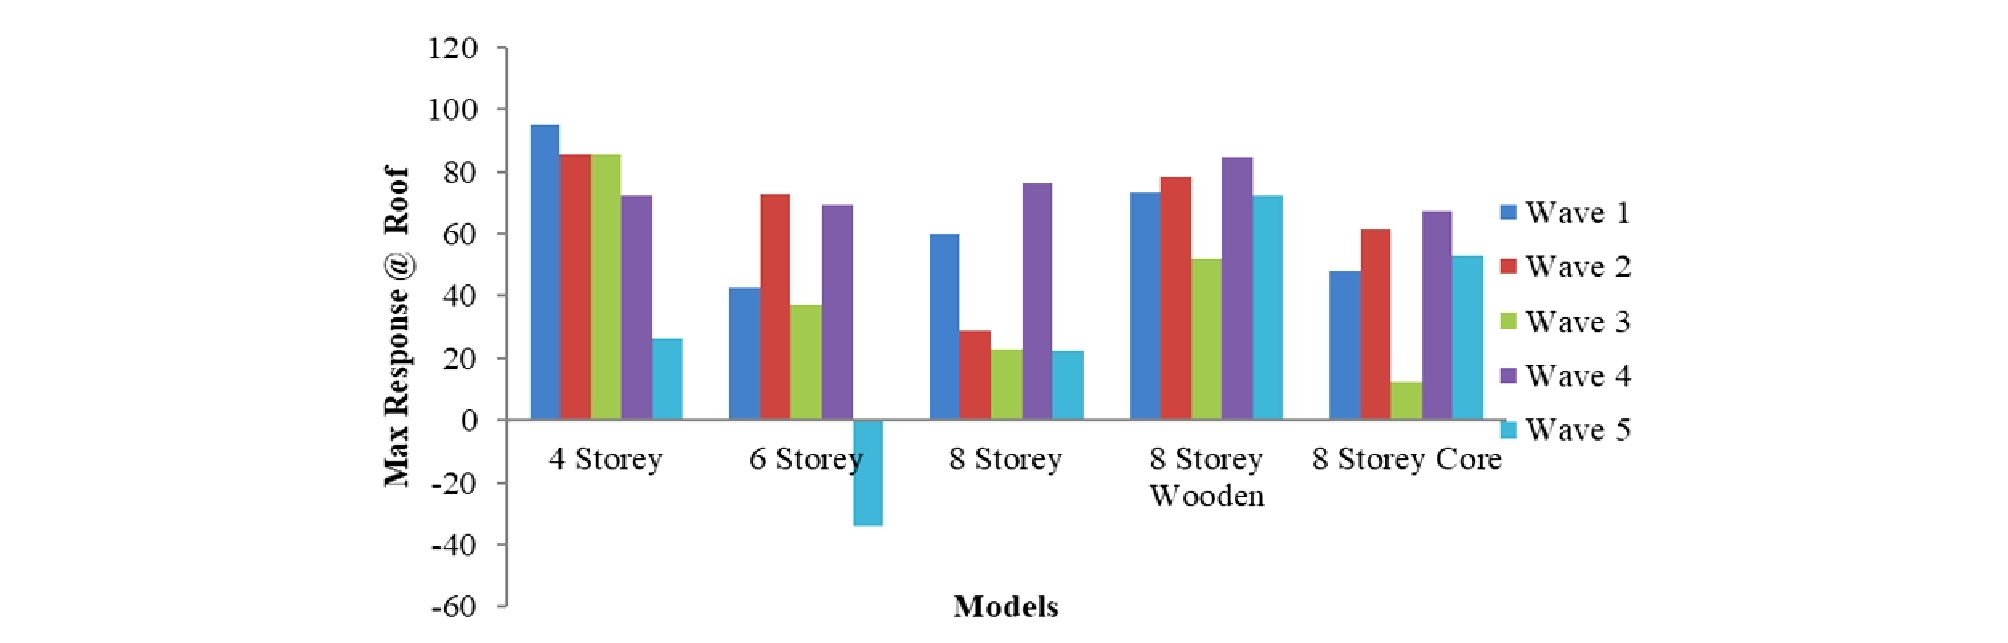
Response reduction due to base isolation
Table 5 and Figure 7 depicts the percentage reduction observed in the top floor accelerations of all the given models when attached with an isolation system in case of metal and core in wooden structures respectively.
Table 5. Top floor acceleration response reductions in models (%)
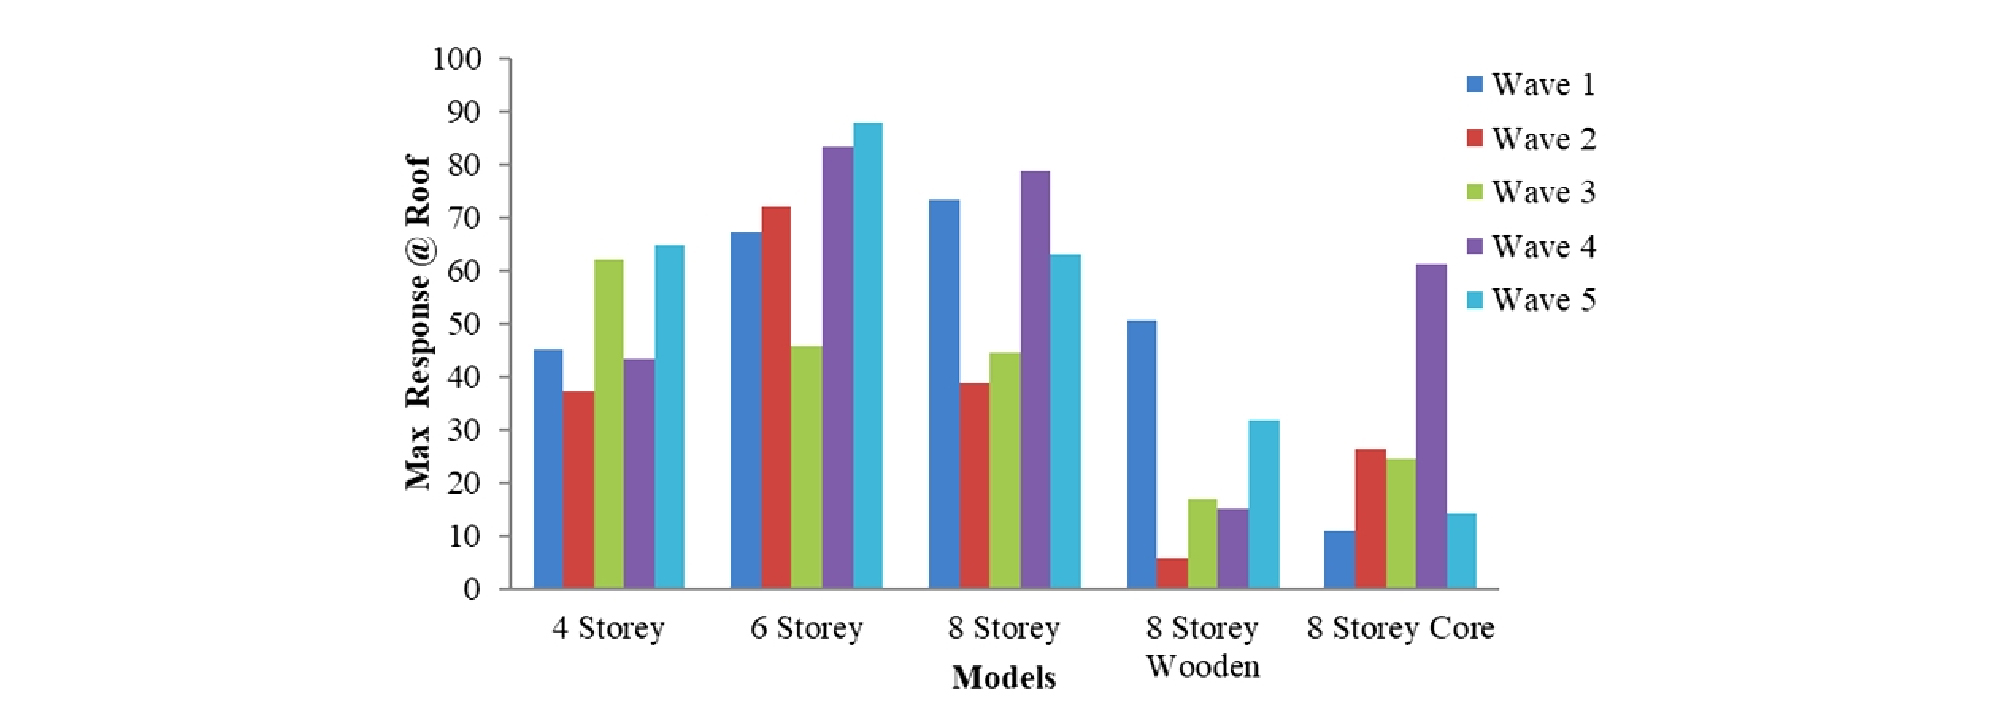
Table 6 and Figure 8 provides an overall view of the reductions in every base isolated plus core wall structure relative to the non-isolated ones subjected to the five different earthquake excitations.
Table 6. Top floor Displacement Response Reductions in models
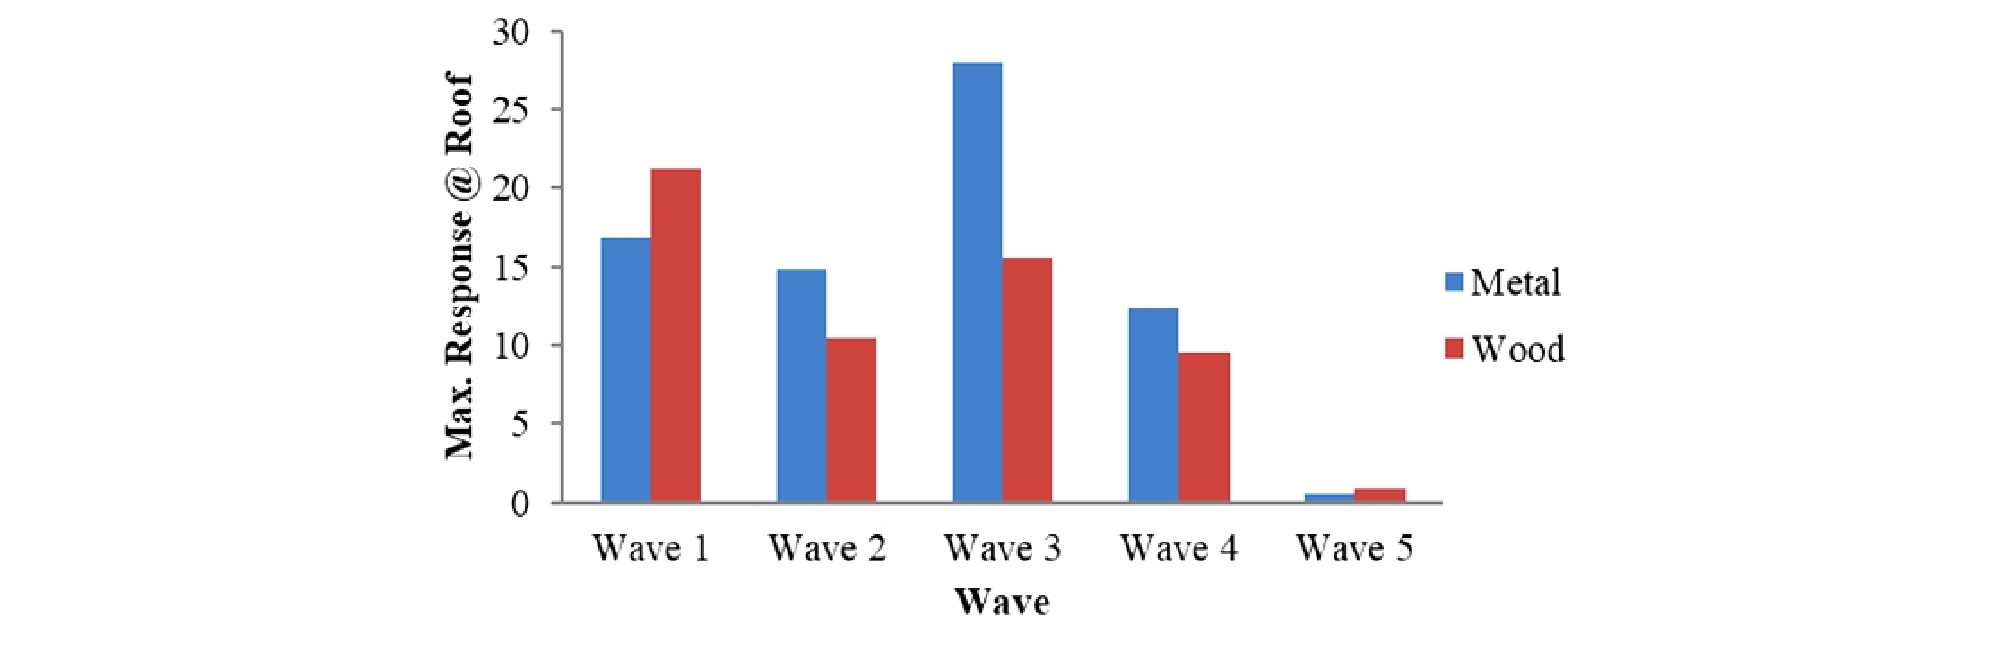
Comparison between 8 storey metal and wooden structural model
It can be inferred from Figure 9 that there is a considerable reduction in acceleration response of a non-isolated fixed base structure when a lighter weight material is used, such as wood in this case. The results show that lesser acceleration is transferred to the wooden structure compared to the model made with iron. This is because acceleration response depends on the mass of the structure and also its stiffness. Since the mass, in this case, has decreased drastically, this automatically increases the natural frequency of the structure in comparison with the same model made of iron. However, in this study, it was observed that the natural frequencies of the entire 8 storey models were similar, which indicated same order of reduction in elastic coefficient (E) and mass (m). Seismic waves Wave 1 and Wave 5 are shortwave earthquakes with the maximum response being within 0.3 and 0.6 seconds respectively. The natural time periods of the models are below 0.15 seconds. Thus, under Wave 1 and Wave 5 the 8 stories wooden model will experience higher response. Since, Wave 2, 3 and 4 are long period waves, the response of the wooden model to these excitations will be considerably lower.
Conclusions
1. The percentage reductions in top floor acceleration response in iron model ranges from 40-80% and displacement reductions were found to be up to 80% over the non-isolated models which are the result of introduction flexibility at the base of the structure.
2. The comparison between metal and wooden model showed a considerable reduction in acceleration response of a structure made of wood due to the transfer of lesser acceleration to the wooden structure. The reason being the acceleration response is dependent upon the mass and stiffness of the structure and by decreasing the mass in this case automatically increases the natural frequency of the wooden structure, and reduces the acceleration response as compared to the metal iron structure.
3. In the model with a core, the acceleration reduction ranges from 10-60% and displacement reductions were found to be between 12-67% over the non-isolated model. Wooden frame model has a higher response than the core structure because the damping ratios (9.02 and 16.8 respectively) were higher for the core wall models. Thus, although expensive, a rigid core system structure can effectively control the vibrations in a structure.
4. The tests indicated different performances of the bearing with varying energy content of the seismic events at the isolator’s frequency. For instance, for Wave 5 (El Centro), a significant reduction in the top floor acceleration (87.96%) was observed. Conversely, the storey displacement increased with respect to the fixed-base building in the events. Wave 1 records the largest base displacements. This finding can be attributed to considerable energy content at the frequency of the isolated structure.
5. Therefore, it can be concluded that using base isolation and core walls in structures can greatly reduce the storey drift and accelerations, by decreasing the transmissibility and ensuring elastic behaviour during strong motion earthquakes, thus minimizing the potential damage.
