

Nomenclature
Introduction
Description of the energy and comfort models for the reference dwelling
Building location, construction details and simulation
Internal gains
Heating system
Calibration and validation
Scenario analysis
Description of the different locations
Description of the hot water central heating
About the control
Description of the thermal rehabilitation of exterior walls
Description of window replacement
Results and discussions
Energy consumption and thermal comfort before the rehabilitation
Energy consumption and thermal comfort after the rehabilitation
Conclusions
Nomenclature
A :Surface area (m²)
AI :Heat gains due to the artificial lighting (W)
Ccr :Fraction of residual heat dissipated in the room (-)
Cme :Special allowance factor (-)
CV (RMSE):Coefficient of variation of the root mean square error (%)
LHV:Lower heating value of natural gas (MJ m-3)
mi :Measured value
n :Number of measured data points
NMBE:Normalized Mean bias error (%)
PMV:Predicted mean vote (-)
Qheat :Sensible heating demand (kj h-1)
si :Simulated value
T99% :Design temperature (°C)
U:Thermal conductance (W m-2 K-1)
V:Velocity (m s-1)
:Flow rate (m3 s-1)
Wn:Nominal wattage of lighting system (W)
Greek Symbols
:Flow rate of natural gas (m3 h-1)
η Efficiency (-)
Superscript
- : Mean value
Introduction
In Algeria, buildings are the most energy intensive sector, representing more than 41% of the national end-use energy consumption. Space heating takes up 46% of the building energy consumption [1]. According to Ghedamsi et al. [2], the total energy consumption of the Algerian residential sector will be increasing from 73 TWh in 2008 to 180 TWh in 2040, which represents an increase of 147% of energy demand in approximately 30 years. Consequently, sustainable energy consumption in Algeria is intimately linked with the improvement of the thermal performance of its existing and future building stock.
The Algerian building stock was estimated to include 7.3 million dwellings in 2011 and 30% of these were built before 1977. A more efficient building stock thus requires not only the construction of low-energy buildings, but also the elaboration of refurbishment solutions to reduce energy needs in already existing buildings.
The Algerian climate is diverse with the North of the country being subjected to a mild Mediterranean climate and the South being located in the Saharan desert. Although the former zone is generally colder than the latter, its winter design temperature (i.e. the temperature value for which the outdoor air temperature is larger 99% of the times) is actually higher than the one in the desert climate due to the cold winter nights in the Saharan region [3]. Between the Mediterranean and the Saharan regions, highlands are found which correspond to the third principal Algerian climate zone. Because of this great diversity of climates, every solution developed to reduce the energy consumption of buildings must first consider the region where the building is located, as optimal solutions for a given climate are not necessarily the best for the other climates.
Energy in Algeria is subsidized and thus electricity for the residential sector costs on average below 4 cents of euros per kWh. According to Ref. [1], this low cost has given rise to high energy consumption intensities since the financial constraints due to the energy consumption are weak. Detrimental impacts are noted both upstream (resource depletion) and downstream (greenhouse gas emissions) in the energy supply chain. More stringent standards and regulations in the Algerian building sector have been adopted [4], but not all are mandatory. For example, no minimal level of insulation is currently enforced by regulations. Energy regulation is known to have a strong impact on building performance and a significant progress has been achieved around the world in order to develop and implement such regulations, including in developing countries [5].
Due to its low installation cost, the most widely used heating system in Algerian residential buildings is the natural gas heater located in the central corridor of each dwelling. Burners are placed in the lower part of the equipment and combustion gases are evacuated in a chimney. In most cases, the heating systems are equipped with a fire ignition system and a thermostat for control. Frequently, the gas valve is controlled manually by occupants to reach the desired heating rate. The drawback of this system is that the heat distribution is not uniform since the heat source is not necessarily located directly in the zone to heat. Another drawback is that manual valve control by occupants can be inefficient. This has been found to increase energy consumption and to produce overheating in the room where the heater is located [6].
The second most widely used heating system is hot water central heating. A gas boiler typically produces hot water that is distributed in radiators located in each room [7]. The circulation of water is ensured by a pump, as thermosiphons are not used anymore [8], and double pipe system is used to connect each individual terminal unit and supply them with the same water temperature [8]. The boilers [7, 8], typically in steel or cast iron, are either semi-automatic (with a standing pilot) or have an auto-ignition with electrodes. For low powers, wall gas boilers are installed in kitchens. The Algerian regulation does not impose any requirement in terms of control. Solutions such as zone regulation with thermostatic valves, regulation with a thermostat and regulation based on outdoor temperature [9] are scarcely used. Occupants rely on the boiler aquastat [10], a system in which the burner is ignited when the water temperature falls below a certain value determined by the user. Despite the recent work of Errebai et al. [11] comparing the effect of different heating systems on indoor temperature, the quantitative “pros and cons” in terms of energy and comfort associated with each type of heating systems in Algerian dwellings are not well documented.
In other countries where the heating load is more important, authors have developed improvements to residential heating systems and have documented their benefits. Monetti et al. [12] showed that the use of thermostatic valves for radiators can reduce energy consumption for heating by 10% in a residential building in Turin, Italy, based on simulations realized with EnergyPlus. Embaye et al. [13] have demonstrated that it is possible to increase the heat generated by radiators by up to 25% using an impulse flow hydraulic network. Based on simulations and measurements. Nägele et al. [14] demonstrated that energy savings between 21 and 26% are possible by adopting a smart control which adapts the temperature setpoints automatically.
In addition to improving the efficiency of HVAC systems, authors have recently studied different ways to cut down the gas and electricity demands in addition to improving thermal comfort in the Algerian built environment. For example, integration of solar heating and cooling systems to different Algerian dwellings was simulated by Bahria et al. [15] They showed that the solar fraction can reach 45% and more when the system is properly optimized, which reduces the consumption of natural gas and electricity for heating and cooling. Architectural design can also be improved to reduce energy consumption and increase comfort. Bekkouche et al. [16] showed that the orientation of a residential building in the Ghardaïa region had a weak effect on its performance in comparison to the level of insulation. Imessad et al. [17] optimized an overhang and the envelope to improve building performance during summer in Algiers, and recommended some design guidelines. Derradji et al. [18] achieved a reduction of 70% of heating and cooling by improving windows and insulation. Insulation thickness between 1 and 2.5 cm was found to be optimal, which is superior to what is seen in typical Algerian residential buildings. Seddiki et al. [19] proposed a decision-making framework for the different stakeholders involved in thermal renovation in order to achieve good results in Algeria. Recent renovation case studies all around the world documented how the choice of renovation measures (insulation level, efficiency of heating and cooling systems, etc.,) needs to be carefully examined [20]. There is thus currently a great interest and need in developing a better understanding of the main factors affecting energy consumption and comfort in Algerian dwellings. As can be seen, one of the limits of current literature on this topic is the lack of information on the impact of the type of heating system and on how to optimize it in the Algerian context. Furthermore, the relative importance of the different building features in terms of both energy consumption and comfort, and the way in which this importance is affected by the choice of heating system and by building location are still needed in order to establish an agenda for enhancing energy efficiency in Algeria.
The main objective of this work is to simulate and analyze the energy performance and comfort during the heating season in Algerian dwellings. The work is based on a numerical model of a typical Algerian dwelling, which can include either one of the two previously mentioned heating systems. Different refurbishments are then applied to the model in order to improve the energy performance. The simulations are repeated for three cities (Algiers, Bechar and Tamanrasset) that adequately represent the different climates found in Algeria. By doing so, it is possible to assess how sensitive conclusions developed from the simulations are to the climate. First, the energy and comfort model of the dwelling developed in TRNSYS is presented in Section 2. The section also describes the calibration process used to validate the model with data obtained from a monitoring campaign. Then, a comprehensive series of refurbishment scenarios is elaborated in Section 3, including the three mentioned locations, the two types of heating systems, three types of opaque envelopes, and two types of windows. Results are discussed in Section 4, which allow to establish the potential energy savings and improvement in thermal comfort during the heating season in the typical dwelling under each scenario.
Description of the energy and comfort models for the reference dwelling
Building location, construction details and simulation
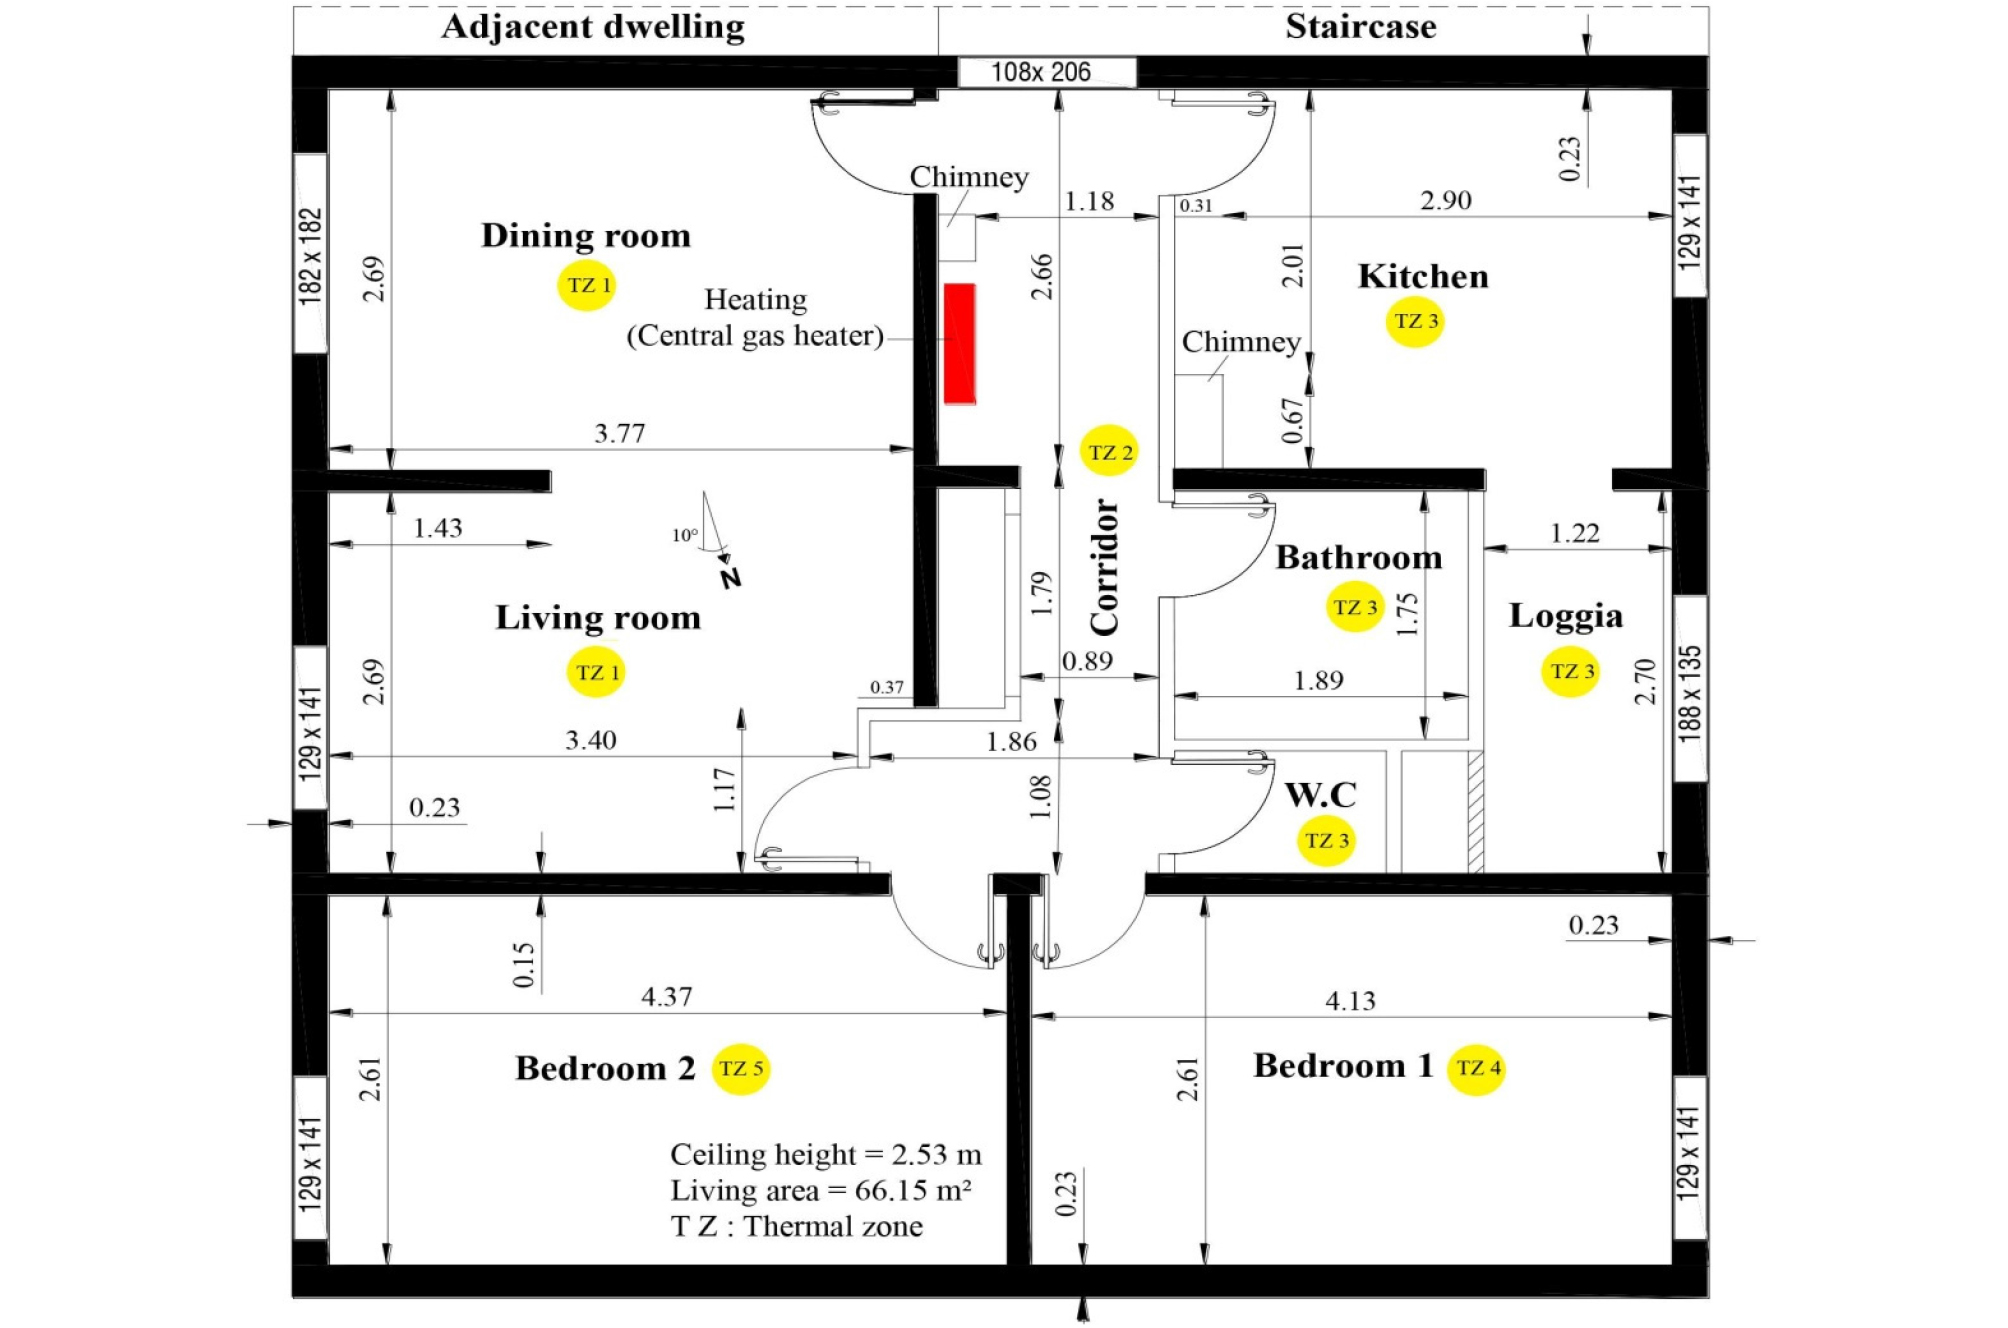
The case-study dwelling of this paper is shown in Figure 1. It is based on a real apartment of 66 m2 in a residential building located in Chéraga (36.46° N, 2.57° E, altitude of 143 m), a suburb of Algiers, Algeria. The building is inhabited by 8 families: 16 adults and about 19 children. This city is located in the temperate Mediterranean climate, which is characterized by rainy and mild winters in addition of hot and humid summers [17].
This particular apartment layout was chosen since data from a measurement campaign in this specific building were available [6]. Measured data provide information regarding the indoor temperature and the gas consumption for two months during the 2003 winter season. This dataset has been used to validate the numerical model as will be described below.
The dwelling was modeled with the dynamic simulation software TRNSYS. In the model, five thermal zones were delineated as shown in Figure 1. The zone #1 includes the dining room and the living room, the zone #2 is the central core with the corridor, and the zone #3 consists of the kitchen, the loggia and the bathroom. Each of the two bedrooms was considered as distinct zones (zones #4 and #5). Thermal interactions between zones were included via conduction through the partitions. When applicable, zone-to-zone air movement through opened doors was also included in the model.
Overall heat transfer coefficients values given in this study are calculated using Algerian thermal regulations [3]. In this technical document, the steady-state heat conduction in one dimension is considered.
The structure is made of reinforced concrete, with 15 cm thick concrete walls and slabs of 16 cm. The façade is in prefabricated concrete panels that are 23 cm thick. The opaque portion of the envelope provided a very small insulation level and was thus characterized by a very large U-value of 3.32 W/m2K. This U-value is larger than currently asked in Algerian regulations (1.2 W/m2K) [3], but reflects practices of the time when the building was erected (1980s). Interior partitions are 8.5 cm thick and are made with hollow bricks with a finish layer of cement-line mortar.
Windows are oriented in the east/west directions which allowed a certain level of passive solar heating. The window to wall ratios (WWR) on the east and west façades are respectively 32% and 28%. The fenestration is composed of a single glazing panel with a wood frame providing poor air tightness. The U-value of the window is estimated to be 5.16 W/m2K [3] and an effective solar heat coefficient (SHGC) at normal incidence of 0.68 [21] was assumed to be representative of this glazing. Direct solar heat gains were distributed uniformly on the floor by TRNSYS [22]. All windows are equipped with wood shutters, except that of the dining room and of the loggia. Typically, shutters are closed at night and opened during daytime (from 8AM to 6PM). Thus, the U-value of the combination of glazing and shutters is equal to 1.80 W/m²K at night [3]. In the simulations, the solar heat gains and overall fenestration U-value were adapted depending on whether the shutters were opened or closed.
Thermal properties of the materials in the dwelling envelope and internal walls were taken from Ref. [3] They were integrated into TRNSYS to define the composition of the different assemblies. Three surfaces (namely the floor, the ceiling and the separation wall with the adjacent apartment) were modeled as adiabatic to represent a contact with identical zones at the same temperature.
The dwelling is naturally ventilated, i.e. no mechanical ventilation system is installed. Indoor air quality is provided solely by infiltration through cracks around windows and by window openings (mostly one-sided natural ventilation due to the layout of the apartment). In a measurement campaign, it was found that the kitchen window was typically opened one hour per day in the morning by the occupants for improving air quality, but that all other windows were kept close in the heating season [6]. This observed window opening schedule was implemented in the model, with the kitchen window being open every day of the simulation from 11AM to noon irrespectively to the internal and external conditions. In the model, and based on data reported in [6], an infiltration rate of 1.1 air change per hour was imposed in zones 1, 3, 4 and 5. When the kitchen window is opened, the infiltration rate was accordingly increased in zone 3 by estimating the air volume flow rate through the opened window based on the following empirical relation [23]:
| $${\dot{\mathrm V}}_{\mathrm{window}}=0.025{\mathrm A}_{\mathrm{window}}\mathrm V$$ | (1) |
where Awindow is the opening surface area and V is the wind velocity. In zone 2, there is no window and only air transfer from other zones can be present (the apartment front door is assumed to be always closed). Since it is not an “occupied” space, so to speak, indoor air quality is not as critical in that zone.
The simulated period in this study covers the period from January 6st to March 5st of 2003. This period was chosen because it corresponds to the one of the measured data. The outdoor temperature used in the simulation comes directly from the monitoring, whereas the rest of weather data (e.g., wind speed, solar radiation) were taken from Meteonorm using the Algiers file. A time step of 1 hour was used in the simulations. Further, refinement of the time steps were tested and did not affect significantly the results.
Internal gains
The apartment is occupied by a single family of five, i.e. a couple with three children. This number is representative of the typical household in Algeria [24]. The occupancy schedules are inspired from those recommended by ASHRAE [25], but were adapted to represent the situation described in other studies on this building [24]. In the simulations, it was assumed that one of the two adults stayed in the dwelling all day long, and that the other occupants were absent between 7:30AM and 5:30PM. During the weekends, all occupants are absent from 1:30PM to 6:30PM. The heat gains per occupant are 100 W for zone 1, 2, 4 and 5 and 150 W for zone 3, since it includes the kitchen, where occupants are expected to be more active. These values correspond to default values proposed by TRNSYS to calculate gains due to occupants.
The dwelling is furnished with different pieces of equipment, such as a refrigerator, a washing machine, etc., which were described in [24]. In the model, it was assumed that there was equipment generating heat gains in all zones except for zone 2. The equipment heat gain was assumed to be 5 W/m2. This value is given by a correlation based on living surface area [26]. Equipment gains were assumed to be 70% radiative and 30% convective [27].
Artificial lighting is turned on at 6:00PM and is provided by eight incandescent lamps of 40 W in the living and dining rooms and by six lamps of 75 W in the other rooms [24]. Before 6:00PM, lighting is assumed to be fully provided by daylight. Heat gains due to the lighting system (when it is turned on) are given by [3] :
| $$\mathrm{AI}=\sum_{}^{}({\mathrm W}_{\mathrm n}{\mathrm C}_{\mathrm{me}}{\mathrm C}_{\mathrm{cr}})$$ | (2) |
where Cme = 1.2 for incandescent lamps and Ccr = 1 for lighting systems not connected to an air extraction system. The heat gain from incandescent fixtures is typically assumed to be 80% radiative and 20% convective [27].
Heating system
As it corresponds to the system used in the real apartment, the most widely used heating systems in Algerian residences was simulated: a cast iron gas heater located in the corridor (zone 2), see Figure 2.

The system has a nominal thermal power of 8 kW. The advantage of this system is its low initial cost of approximately 300 euros.
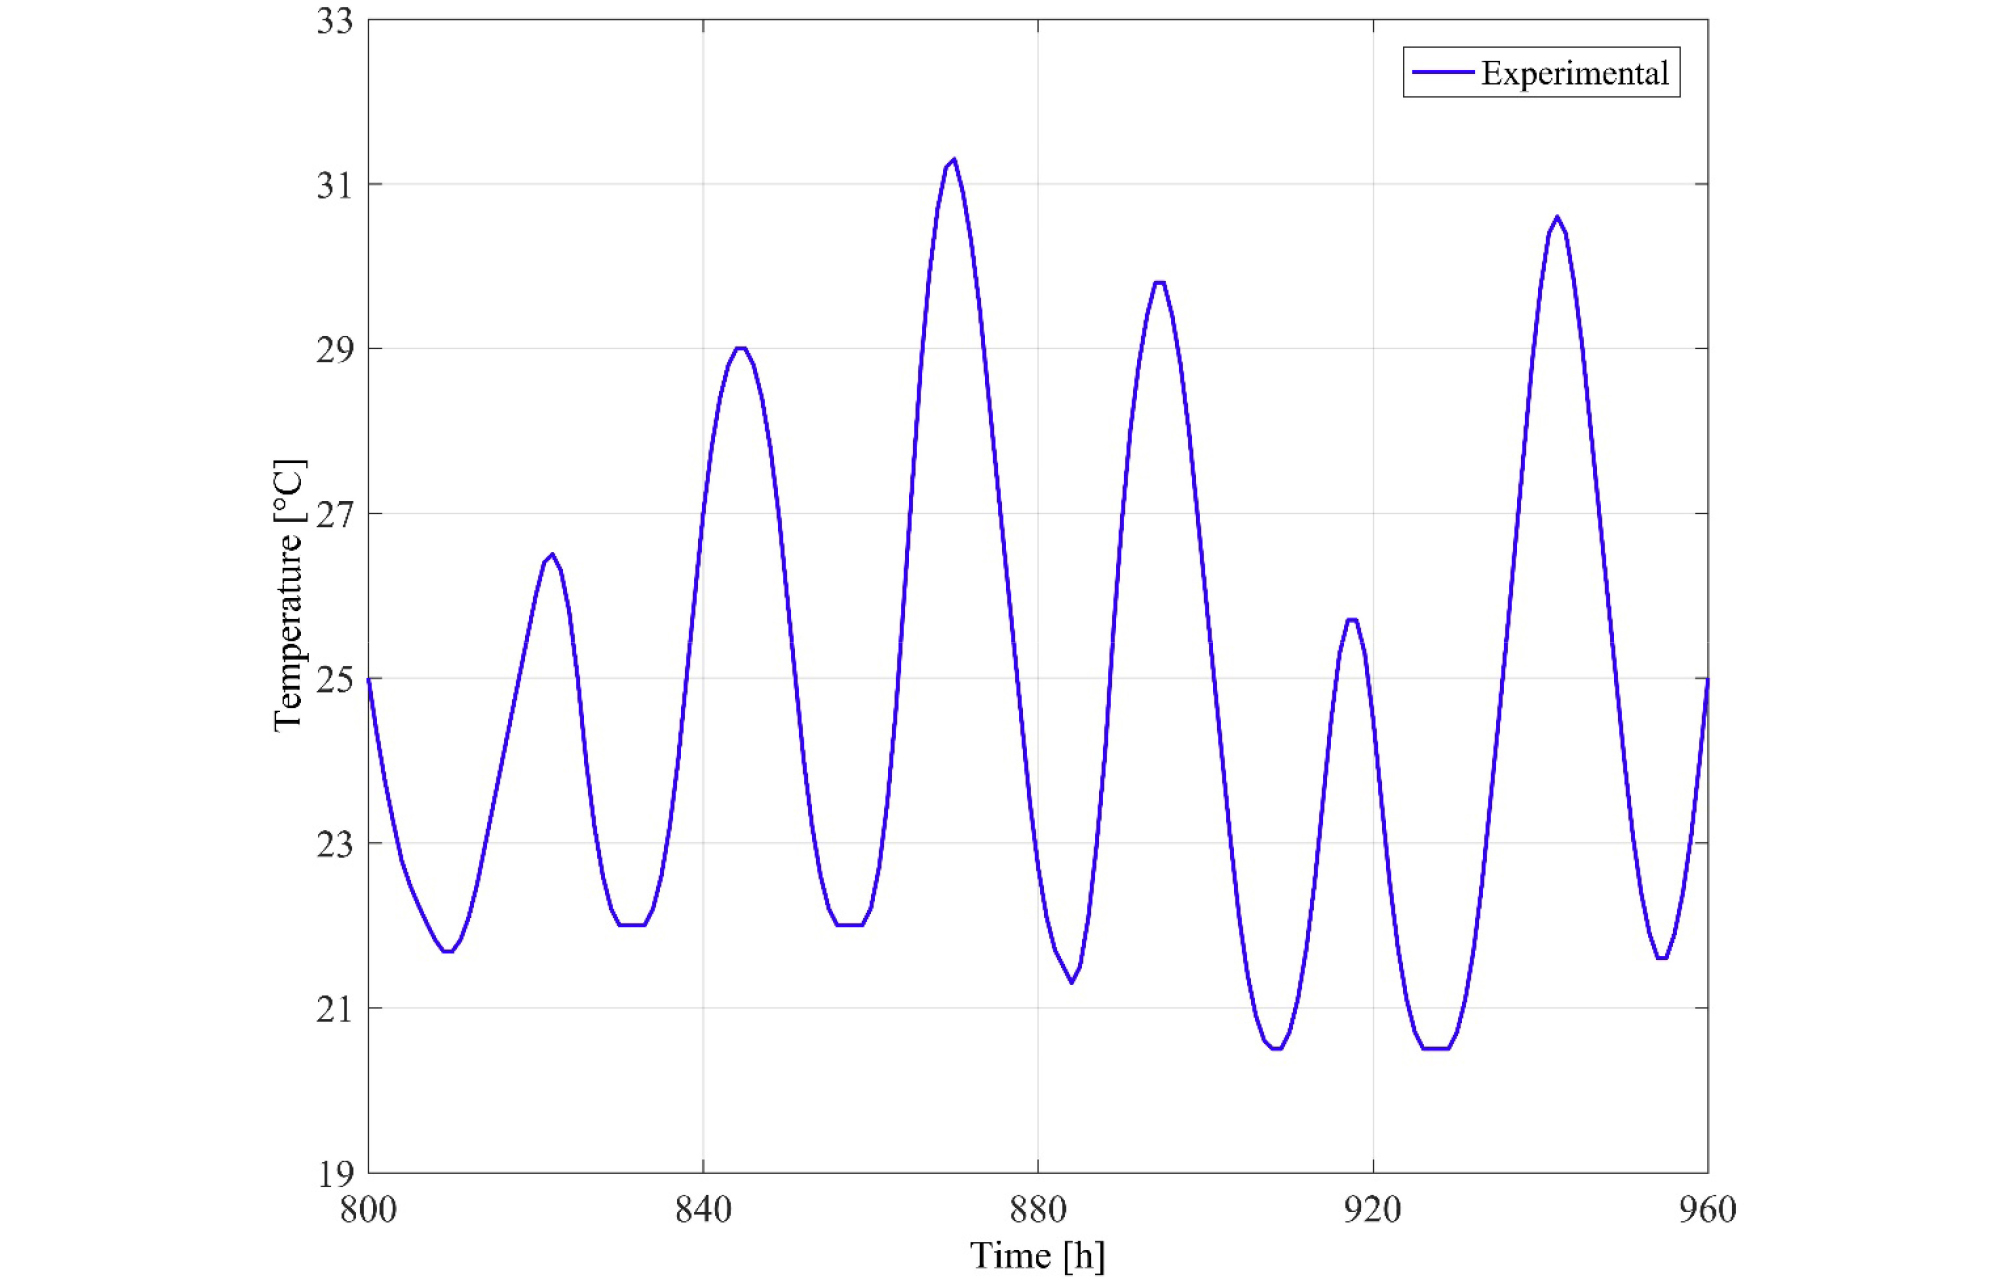
However, there is a major drawback in installing heater in the corridor: we observe significant overheating in the corridor (see Figure 3) and thus important heat losses from the corridor to the staircase. Corridor air temperature often exceeds 30°C. In the actual apartment, the gas flow rate is adjusted manually by occupants via a valve. Often, the valve was partly opened, resulting in a gas flow rate of ~0.48 m3/h. When the temperature was very low, the valve was fully opened by occupants and the gas flow rate could reach ~0.65 m3/h.
Since TRNSYS did not have a specific type to simulate this piece of equipment, a home-made model was developed and implemented through the available calculators in the simulation studio [28]. Calculators for gas flow rate and produced heating were respectively connected to the temperature controller (Type 1502 in TRNSYS) and the building (Type 56). Once the gas flow rate is known, the heat transfer rate from the heater is calculated by:
| $${\mathrm Q}_{\mathrm{heat}}=\eta\mathrm L\mathrm H\mathrm V\phi_{\mathrm{gas}}$$ | (3) |
An LHV of 34.54 MJ/m3[18] with an efficiency of 0.78 [6] were used to relate the sensible heating demand to the natural gas consumption [29].
Calibration and validation
The TRNSYS model was validated by comparing the natural gas consumption of the dwelling, as well as the air temperature in zone 5 (one of the bedrooms), to the ones that were measured experimentally [6]. Zone 5 was chosen because along with the corridor (zone 2), it was the zone for which monitored indoor temperature was available. The sensor in zone 5 was located near the door of the bedroom, at a height of 1.5 meters above the floor. The validation was performed in two steps. First, the temperature evolution measured in the corridor (i.e. where the heater is installed) over that period was imposed in zone 2. In other words, heating in zone 2 was adjusted at each time step in order to follow the measured temperature value in that zone. Knowing the required amount of heat, the efficiency of the gas heater, and the LHV of gas, the gas consumption can be estimated from Eq. (3). The building simulation allowed to calculate the temperature in the other zones.
As an example, Figure 4 compares measured and projected air temperatures in zone 5 for a typical week in winter. The displayed week goes from February 3rd to February 9th, so from the 800th hour of the year to the 960th.
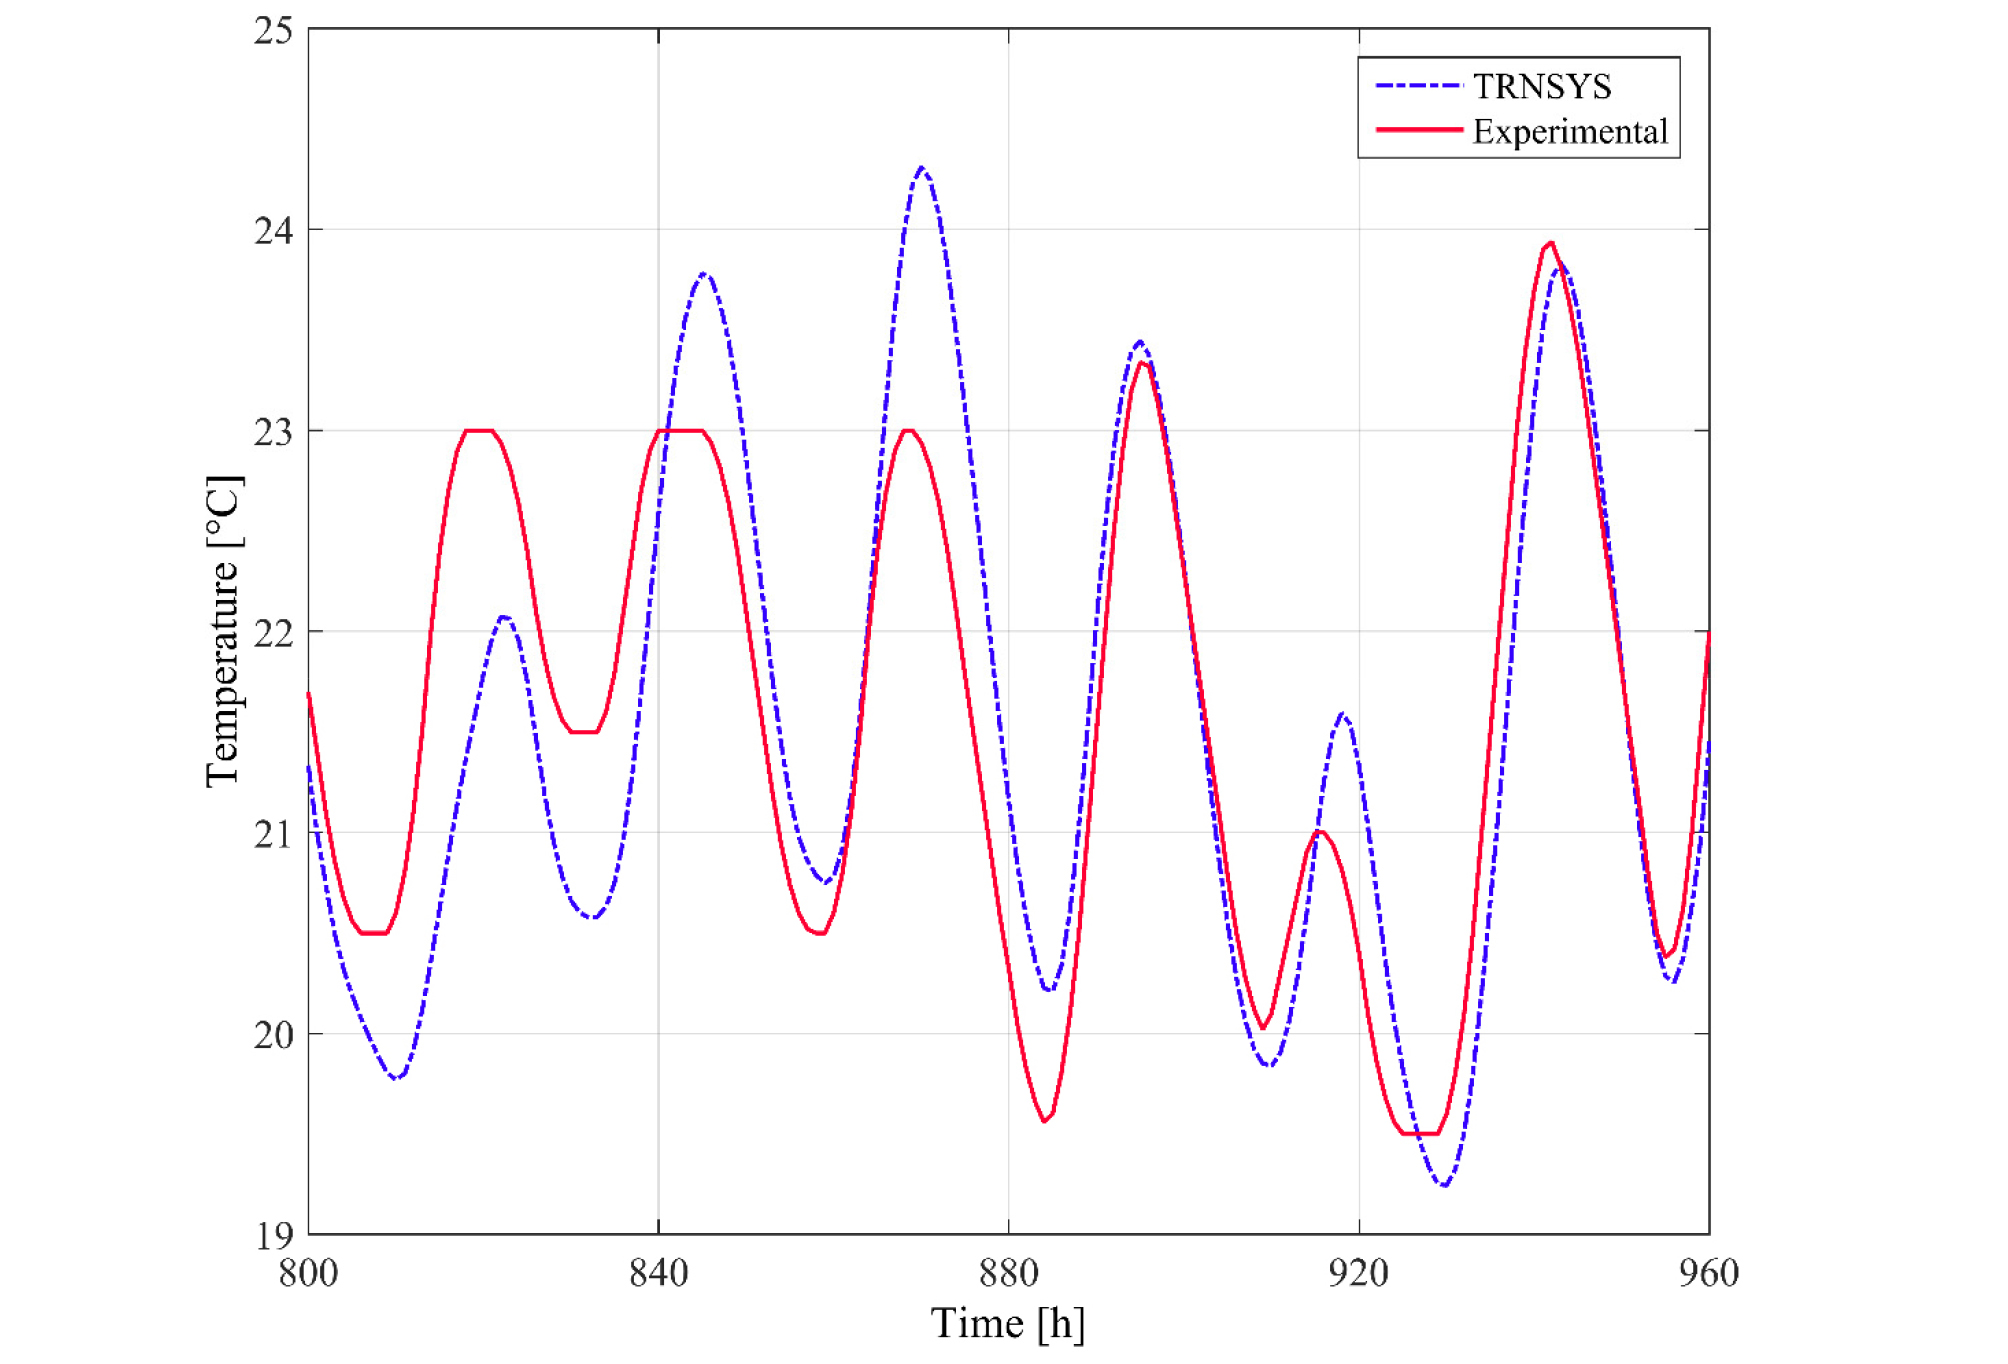
The difficulty of determining air transfers between zones explains why the calculated and experimental values are relatively different. In particular, air transfer between the corridor (zone 2) and the other zones through the doors was found to be a significant parameter to distribute the heat appropriately in the dwelling [30]. As mentioned in other studies, it is often difficult to determine the natural air movements that are generated by a high temperature stove in built environments [31].
Given the uncertainties of the measurements using the thermo-hygrograph instrument (accuracy ± 0.5°C [32]), the “stochastic” nature of occupied dwellings and the potential difference between local weather and the dataset used for the simulations, the agreement can be qualified of satisfactory, with average air temperature differences over the total simulated period being less than 0.84°C. The total natural gas consumption was estimated using Eq. (3) by the model to be at 390.78 m3 (56.66 kWh/m2) whereas the real consumption was 401 m3 (58.15 kWh/m2) [6], which is an underestimation of 2.5%.
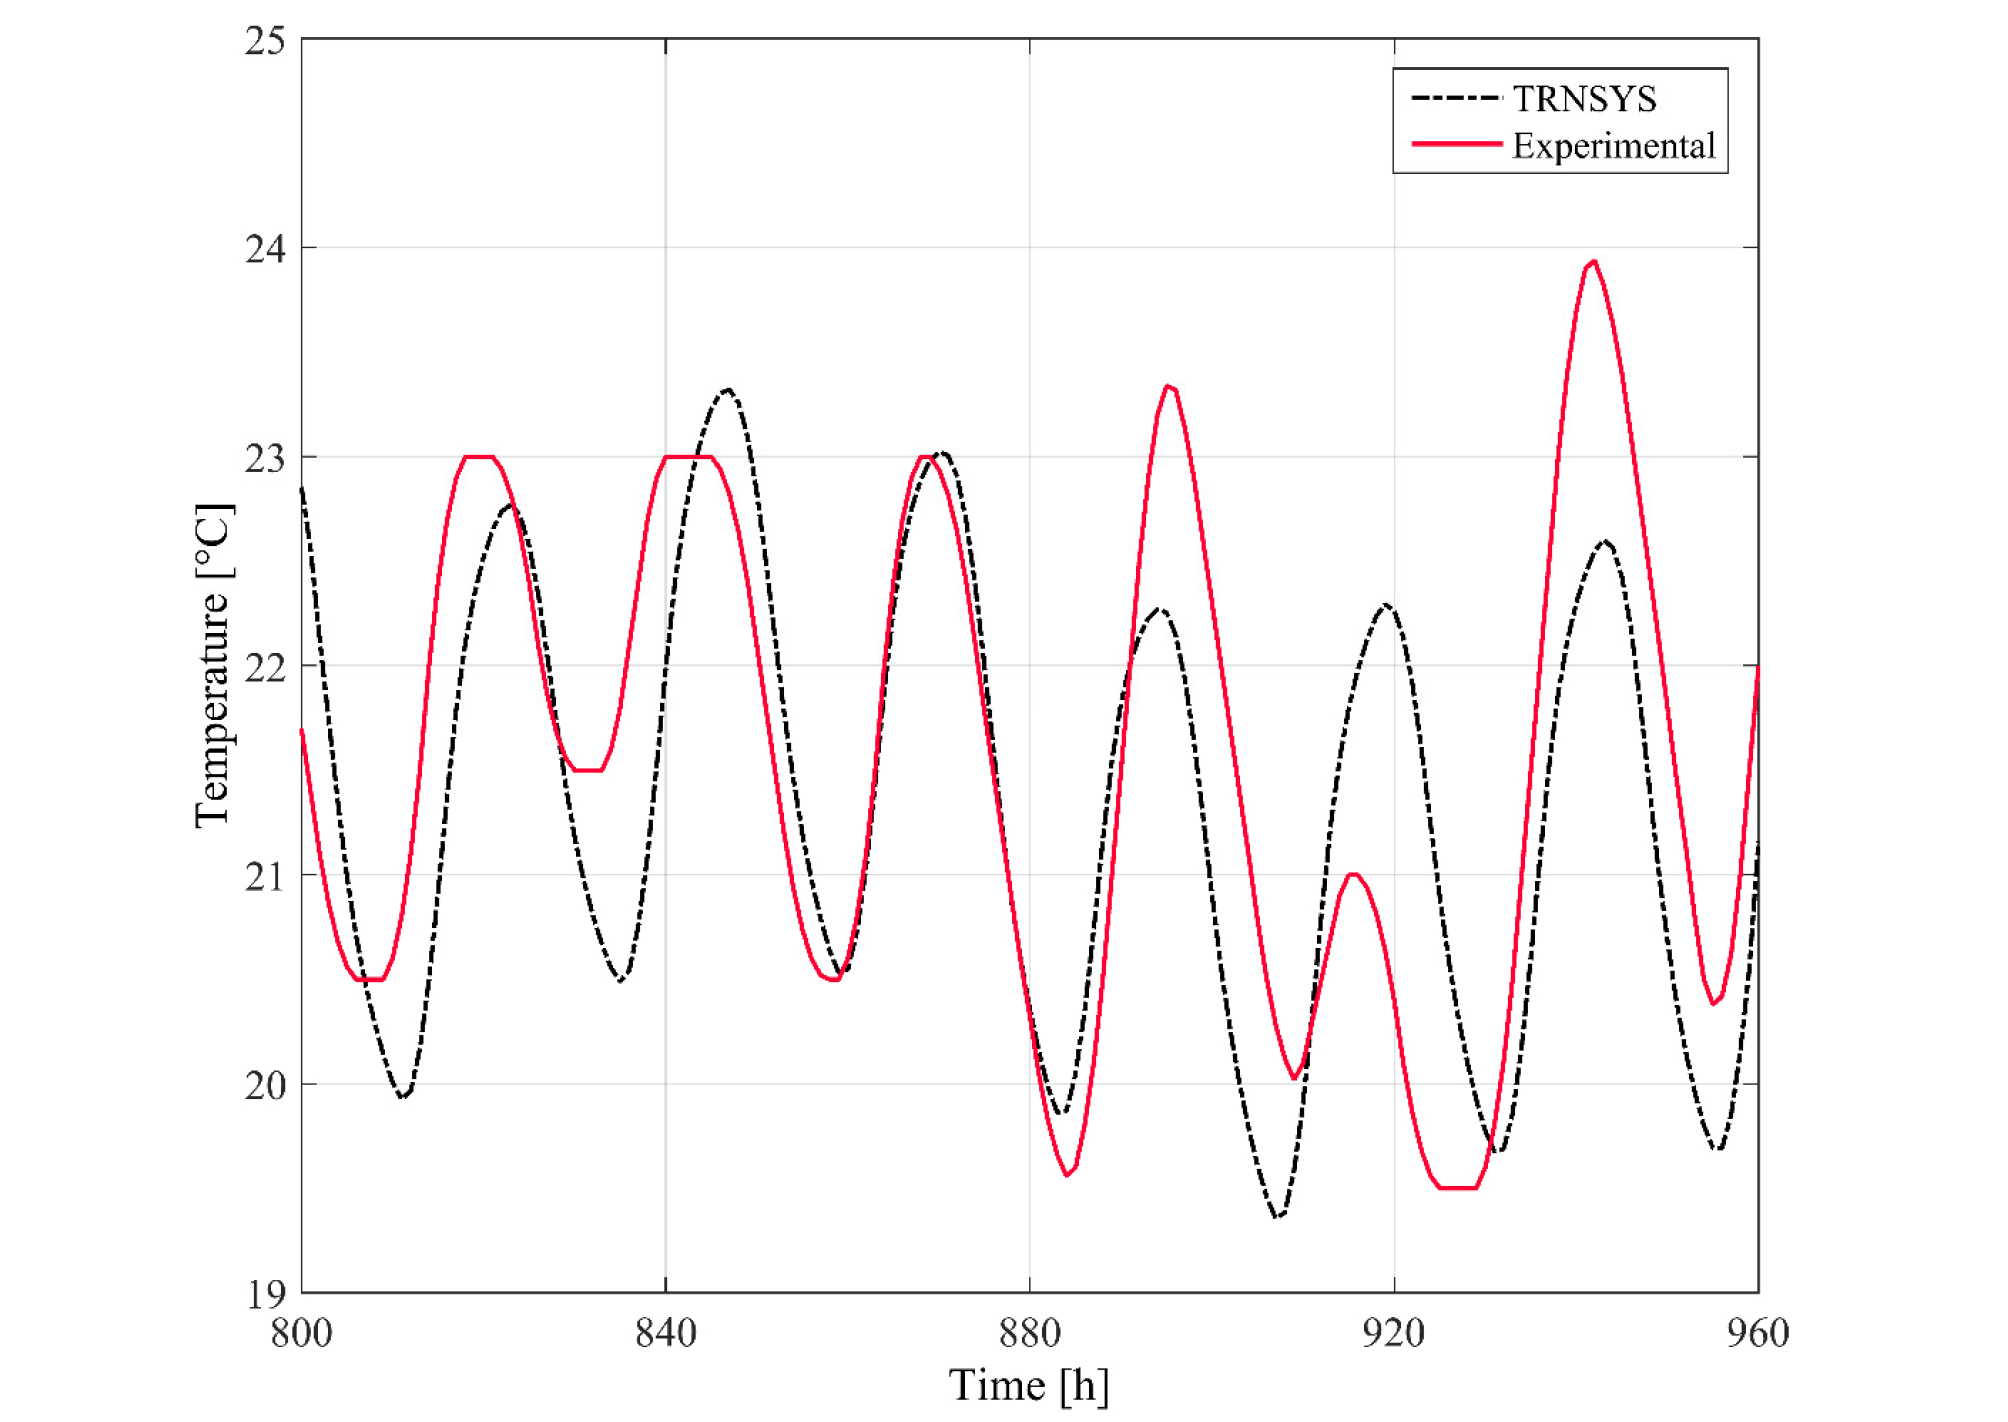
The second step for the calibration and validation of the model was to implement a control strategy for the heater rather than imposing the experimental temperature in zone 2. Since the real system is actually controlled manually by occupants, the experimental temperature evolution in zone 2 (i.e. the zone where the heater is located) was studied in order to understand when the occupants would typically turn on the heater and when they would turn it off. The model was adjusted until it calculated adequate temperature evolutions in zone 5. The following control strategy was found to approximate the behavior of occupants:
(i) When the air temperature in zone 5 drops below 21°C, the heating is immediately turned on at full capacity, i.e. the regulating valve is completely open and the gas flow is 0.65 m3/h;
(ii) When the air temperature in zone 5 is above 24.5°C, the heating system is turned off;
(iii) When the air temperature in zone 5 is between 21°C and 24.5°C, the regulating valve is partially open (gas flow of 0.48 m3/h);
(iv) The equivalent temperature dead band of the thermostat is 4°C.
(v) The heating system is turned off between 9:00AM and 8:00PM.
Figure 5 compares temperature measurements in zone 5 as a function of time to the simulated temperature calculated with this control strategy during a typical week. Again, given the complexity of real occupant behavior and the level of uncertainties [33], the agreement was considered acceptable with an average temperature difference below 1.50°C.
Regarding the gas consumption, the simulation of the second phase calibration predicted a total consumption of 389.26 m3 of natural gas. Since the reported consumption was 401 m3, the model can be considered to be adequate with that respect.
Finally, in order to assess the precision of the model and determine the level of confidence of the measurement and calibration procedures, the normalized mean bias error (NMBE) and the coefficient of variations of the root mean square error (CV(RMSE)) were calculated [34]. NMBE gives the global difference between real and predicted values by dividing the average of errors of a sample by the mean of measured values :
| $$\mathrm{NMBE}=100\%\times\frac1{\overline{\mathrm m}}\times\frac{{\displaystyle\sum_{\mathrm i=1}^{\mathrm n}}\left({\mathrm m}_{\mathrm i}-{\mathrm s}_{\mathrm i}\right)}{\mathrm n}$$ | (4) |
where mi is the measured value, si, the simulated value, is the mean of measured value and n, the number of measured data points. As for CV(RMSE), it provides information regarding the ability of a model to predict the overall behavior of measured data by measuring the variability of the errors between measured and simulated values:
According to ASHRAE, an adequately calibrated model should have a NMBE value lower than 10% and CV(RMSE) should be smaller than 30% with respect to hourly measurements [35, 36]. Table 1 presents the values that were obtained for these criteria with the procedure outlined above and demonstrates the validity and level of precision of the calibrated model. No CV(RMSE) indicator was calculated for the total volume of gas consumed for heating since it is not a temporal profile – there is only one measured data point, so only the relative error of the model was evaluated.
Table 1. Error calculations for the two steps of the calibration and comparison with ASHRAE recommendations
| Model Output | Criterion |
First step of calibration |
Second step of calibration |
Requirement of ASHRAE Guideline 14 [35][35, 36] |
| Air temperature in zone 5 | NMBE [%] | 2.09 | 2.49 | 10 |
| CV(RMSE) [%] | 4.88 | 8.52 | 30 | |
| Natural gas consumption for heating | NMBE [%] | 2.55 | 2.93 | 10 |
Scenario analysis
As described above, the heating system in the reference dwelling is a corridor gas heater, which is very common due to its low purchase cost. The main shortcoming of the central gas heater system is the lack of uniformity of the temperature in all zones of the dwelling. Compared to the corridor (zone 2 in the model), it is more difficult for the heat generated by the heater to reach other zones. As a result, the corridor is substantially warmer than other zones, which potentially leads to discomfort. This scenario is undesirable even if occupants rarely stay in the corridor for long durations. Therefore, two heating systems were simulated: the central gas heater (as in the reference dwelling) and a system based on hot water radiators installed in each zone. This heating system based on hot water radiators prevents overheating.
The TRNSYS model was used to simulate the behavior of the dwelling under different scenarios. The objective is to estimate the potential energy savings and improvement the thermal comfort in the dwelling when solutions are applied. The scenario analysis is summarized in Table 2. Furthermore, in addition to the reference wall assembly (i.e., prefabricated concrete panel) and window type (i.e., single glazing), five enhanced opaque wall assemblies and a double glazing window type were also studied. The analysis was performed for three Algerian cities, namely Algiers (reference climate), Bechar and Tamanrasset to cover the different climate zones of the country. Below is a description of these different scenarios. A total of 72 simulations were carried out to cover all possible combinations of these parameters.
Table 2. Scenarios for the simulations performed in this work
In addition to determining the natural gas consumption, the model was used to evaluate the number of hours of discomfort. Thermal comfort is defined by the following main influencing factors: indoor air temperature and radiation temperature, air velocity, relative humidity of the indoor air. In turn, the effect of these main influencing factors on a person's sense of comfort depends on his or her (level of) activity and clothing. The international standard ISO 7730 combines all of the parameters in the PMV/PPD measurement (Predicted Mean Vote/ Predicted Percentage Dissatisfied). The PMV is an index which predicts the average climate assessment value of a large group of people. The PPD Index provides a quantitative prediction of the number of people that will be dissatisfied with a certain ambient atmosphere. Whenever the PMV value was above 0.5 or below –0.5, it was considered as an uncomfortable indoor environment. The PMV value was evaluated with a value of 1.2 clo for the clothing insulation. This typical value was chosen based on a field survey [37] on thermal comfort in Algeria in which clothing insulation was found to vary between 0.8 and 1.6 during the heating season depending on the occupant, the interior temperature and other variables. The number of hours of discomfort for the simulated period (i.e., a total of 1,416 hours) was calculated for each zone and then averaged over the different zones of the dwelling.
Description of the different locations
As presented in Table 2, three Algerian locations were considered in this study to assess the variations of the results between cities located in Mediterranean and desert climates. These locations are Algiers, Bechar and Tamanrasset. They were chosen since meteorological data was easily accessible through the Meteonorm package files. Table 3 summarizes the main climatic data of these cities.
Table 3. Climatic data for the chosen cities [source: National Meteorological Office]
The city of Tamanrasset (22.47° N, 5.31° E, altitude of 1377 m) is in the desert region of the south of Algeria (Sahara). It is defined by an arid climate, with extremely few precipitations – less than 70 mm per year, and winters that are mild and summers, hot [15]. Nevertheless, the value of the design winter temperature T99% is around -0.5°C [3]. The city of Bechar (31.37° N, 2.14° W, altitude of 772 m) is also situated in the Sahara, but in the Northern region of the desert so climate variations between Bechar and Tamanrasset are observable as shown in Table 3. Desert climates are characterized by very warm days, but also by their cold nights, hence the relatively low T99% values for Tamanrasset and Bechar when compared with Algiers in Table 4. As a result, heating is required in these two cities in the winter, but the heating demand is expected to be lower than the one in Algiers because of the smaller number of degree-days of heating (simulation results will be described below). Note that the degree-days of heating in Table 4 are based on a reference temperature of 18°C and are for the entire year based on the Meteonorm files data.
Table 4. Simulations results for the dwelling with the reference dwelling
Description of the hot water central heating
A hot water loop connected to a wall gas boiler (efficiency of 96%) positioned in the loggia provides heating via radiators installed in each zone (see Figure 6). In spite of its relative high cost (i.e., ~1050 euros versus ~300 euros for the reference heating system), this system is also among the most widely used in Algerian dwellings. It has another advantage over the reference heating system in that the efficiency of gas boilers are typically higher than that of gas heaters.
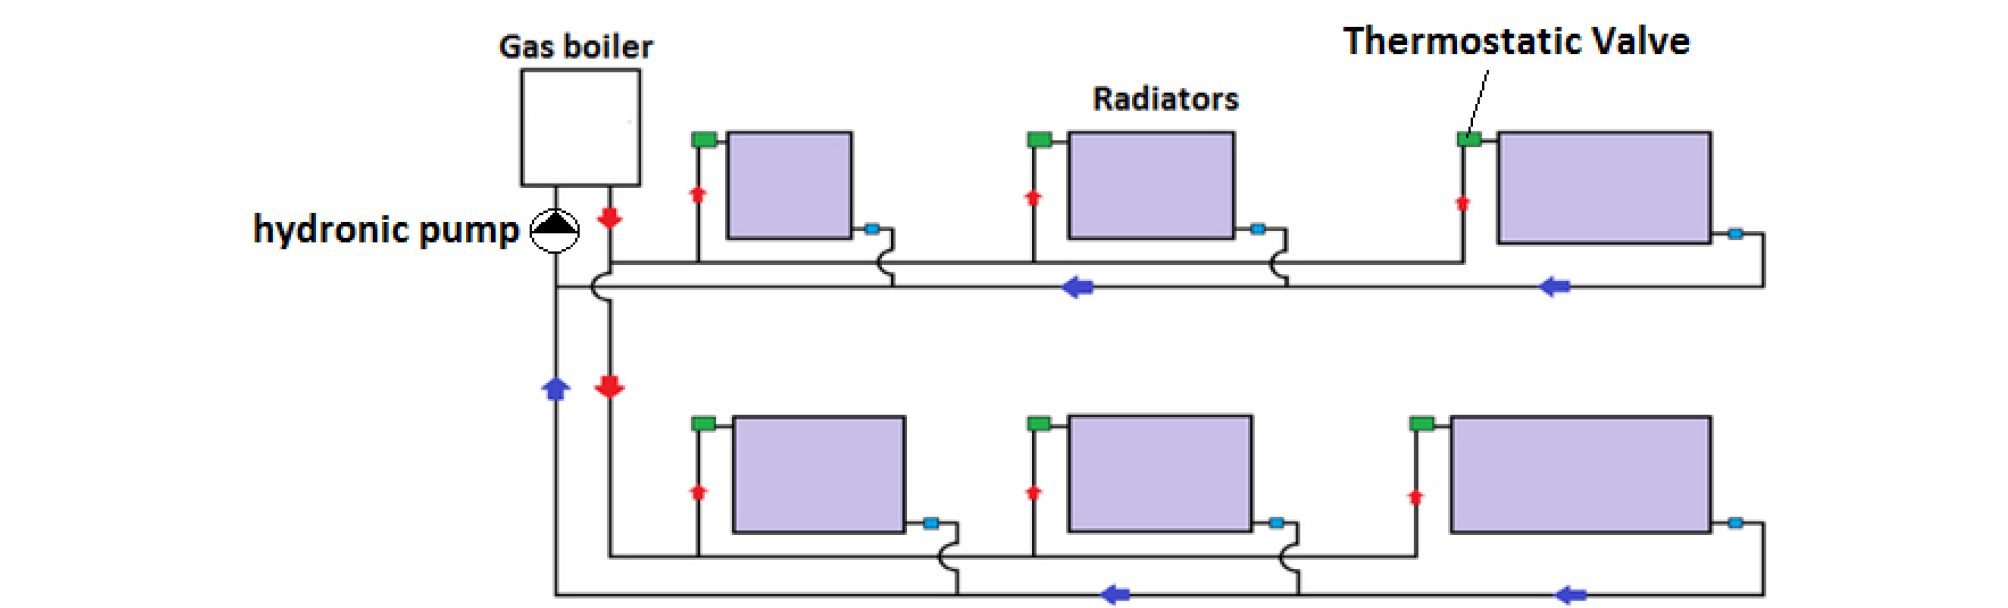
Type 1231 of TRNSYS was used in the model to reproduce the radiators. According to ASHRAE [7], this type of heating system emits more heat by radiation. Accordingly, the radiative fraction has been set to 54% in the model versus 46% for convection [38]. The radiators were sized for each zone based on the requirements of Algerian building regulations [3]. The input temperature of water is 50°C whereas the return temperature depends on several variables (room temperature, water flowrate…) and is calculated by Type 1231 in TRNSYS. The control of the system is done by modulating the water flow rate in the radiators with the same procedure as the scenario found during the calibration of the dwelling model. One thermostat, located in zone 5, is installed in the model. It is worth to mention that the building model was calibrated above for a central gas heater system, which was the system installed in the dwelling in which measurements were made. This procedure allowed calibrating several model parameters to their most appropriate values (e.g., material properties, occupancy schedule, etc.). These parameters were kept the same in the building model with radiators, the only difference being the type of heating system.
About the control
For the reference system, the control is performed from zone 5 (bedroom 2). If the air temperature of this zone is higher than 24.5°C, the gas heater (located in the corridor) is switched off. If the air temperature is below 21°C, the gas heater is switched on. This control strategy approximates the behavior of occupants (see above, calibration and validation paragraph).
For the hot water central heating system, the control is performed independently in all rooms. If the air temperature of the room is higher than 24.5°C, the radiator is switched off. If the air temperature is below 21°C, the radiator is switched on.
Description of the thermal rehabilitation of exterior walls
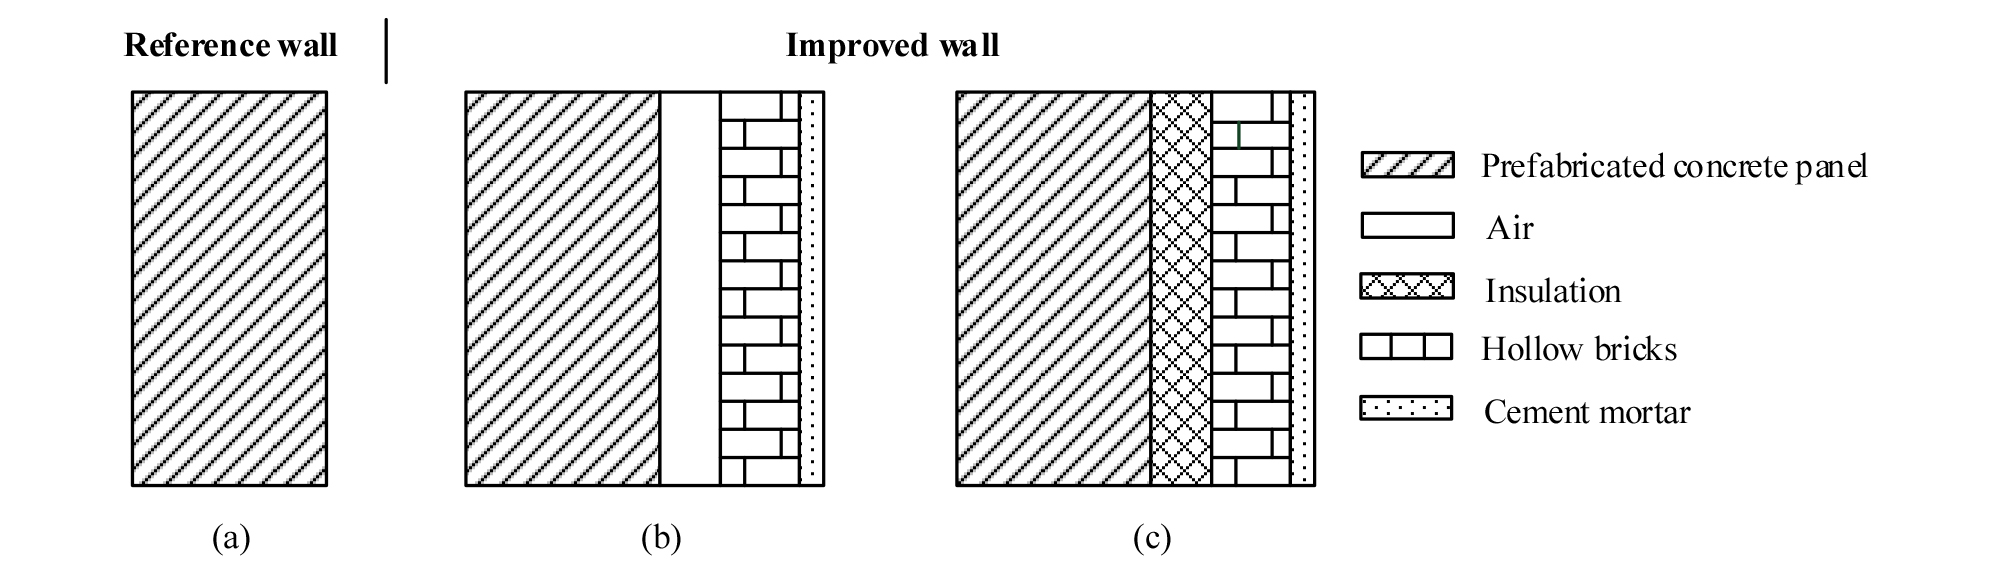
In the simulations, it was observed than the internal surfaces of the exterior walls of the dwelling were substantially colder than the indoor air. This is explained by the lack of thermal insulation in these walls. which leads to colder wall surfaces. According to the thermal comfort theory, low radiant temperatures cause discomfort even for relatively warm indoor air temperature. In order to eliminate this cold wall effect, and thus enhance comfort and reduce gas consumption, thermal rehabilitation of the envelope was simulated as shown in Table 2. Different strategies are possible to increase the level of thermal insulation of existing envelopes, i.e. insulating by the exterior or by the interior. The choice of position of the added thermal insulation (interior or exterior) in rehabilitated envelopes is influenced by several factors. Interior insulation is known to reduce heating and cooling demand in addition of discomfort caused by low wall temperature [39], but it also reduces the available space. Thermal bridges are also not always easy to minimize with this approach. On the other hand, exterior insulation can provide comfort during transitional seasons, but increases the footprint and the cost of materials since the total volume of insulation is increased. In this work, interior insulation was chosen. Two additional types of assemblies were tested:
(i) In the first wall assembly (see Figure 7b), hollow bricks and cement mortar layers are added to the interior, and an air gap layer is left between the existing concrete panels and the added layers. With this approach, the U-value of the opaque envelope is reduced from 3.32 W/m2K to 1.50 W/m2K with a 2 cm air gap and to 1.44 W/m2K with a 5 cm air gap [3].
(ii) In the second wall assembly (see Figure 7c), insulation is installed from the interior. The same assembly as above is used, but the air gap is replaced by an insulation (polyurethane, thermal conductivity of 0.031 W/mK). Three values of the insulation thickness have been simulated (2 cm, 5 cm and 8 cm) resulting in U-values of 0.86 W/m2K, 0.47 W/m2K and 0.32 W/m2K respectively [3].
Description of window replacement
Windows in the reference building are a weak element in terms of heat losses, due to conduction losses through the glazing and frames as well as to air infiltration between the sash and frame [1]. Therefore, a scenario in which windows were improved by using double-glazing with an aluminum frame was considered: air space of 12.7 mm, glazing thickness of 3.2 mm, emissivity of the low-e glasses equal to 0.10. The effective U-value of the improved window is 1.76 W/m2K and its effective solar heat gain coefficient at normal incidence is 0.6 [28]. The infiltration rate was reduced to 0.5 air change per hour [40] to account for a better fitting.
Results and discussions
Energy consumption and thermal comfort before the rehabilitation
The results for the dwelling with the reference heating system and the reference envelope are shown in the last columns of Table 4. As expected from the climatic data, the dwelling gas consumption in Bechar and Tamanrasset is smaller than in Algiers, i.e. 375.44 m3 and 303.04 m3 versus 389.26 m3. Similarly, Table 4 reveals that thermal discomfort is somewhat less present in these two cities than in Algiers (825h and 419h versus 918h). The thermal discomfort of the dwelling was estimated by calculating the discomfort in all five zones and then computing the mean value. Again, these numbers of hours of discomfort are for a simulation period of 1,416 hours, so 825 hours of discomfort translates in a frequency of discomfort of 58%. Nevertheless, it is visible that the reference heating system and envelope lead to a large energy consumption for heating (intensities goes from 43.94 kWh/m2 in Tamanrasset to 56.44 kWh/m2 in Algiers) and low thermal comfort in all three cities.
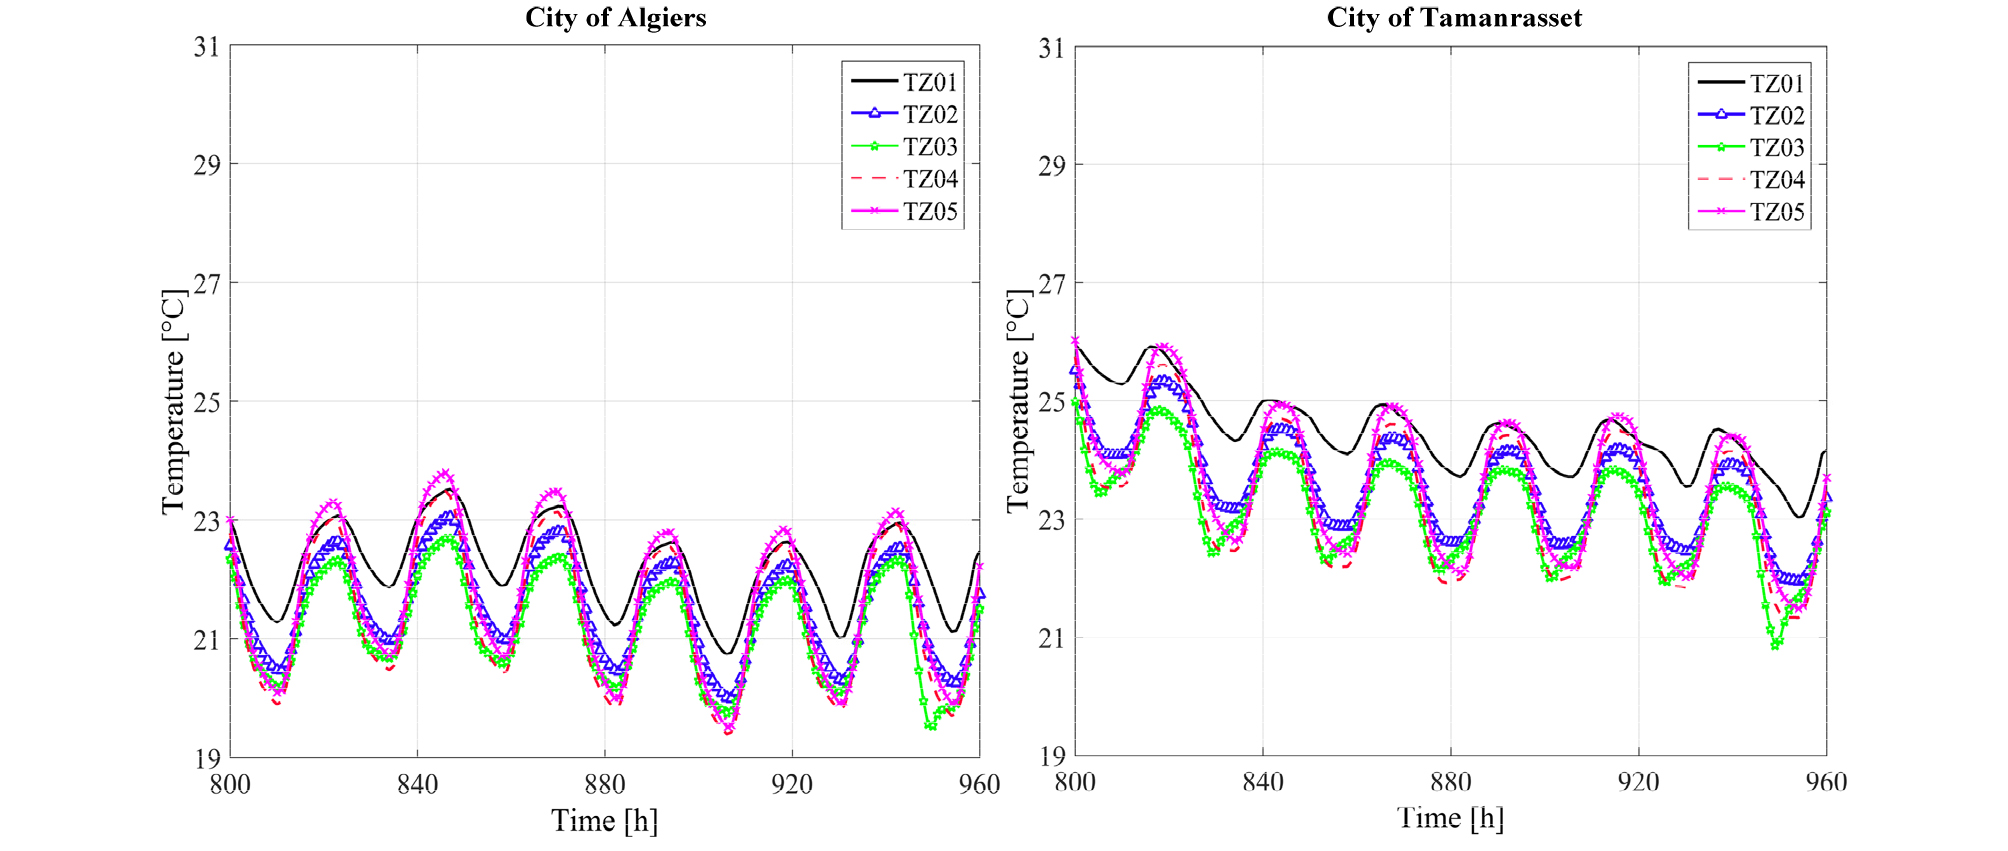
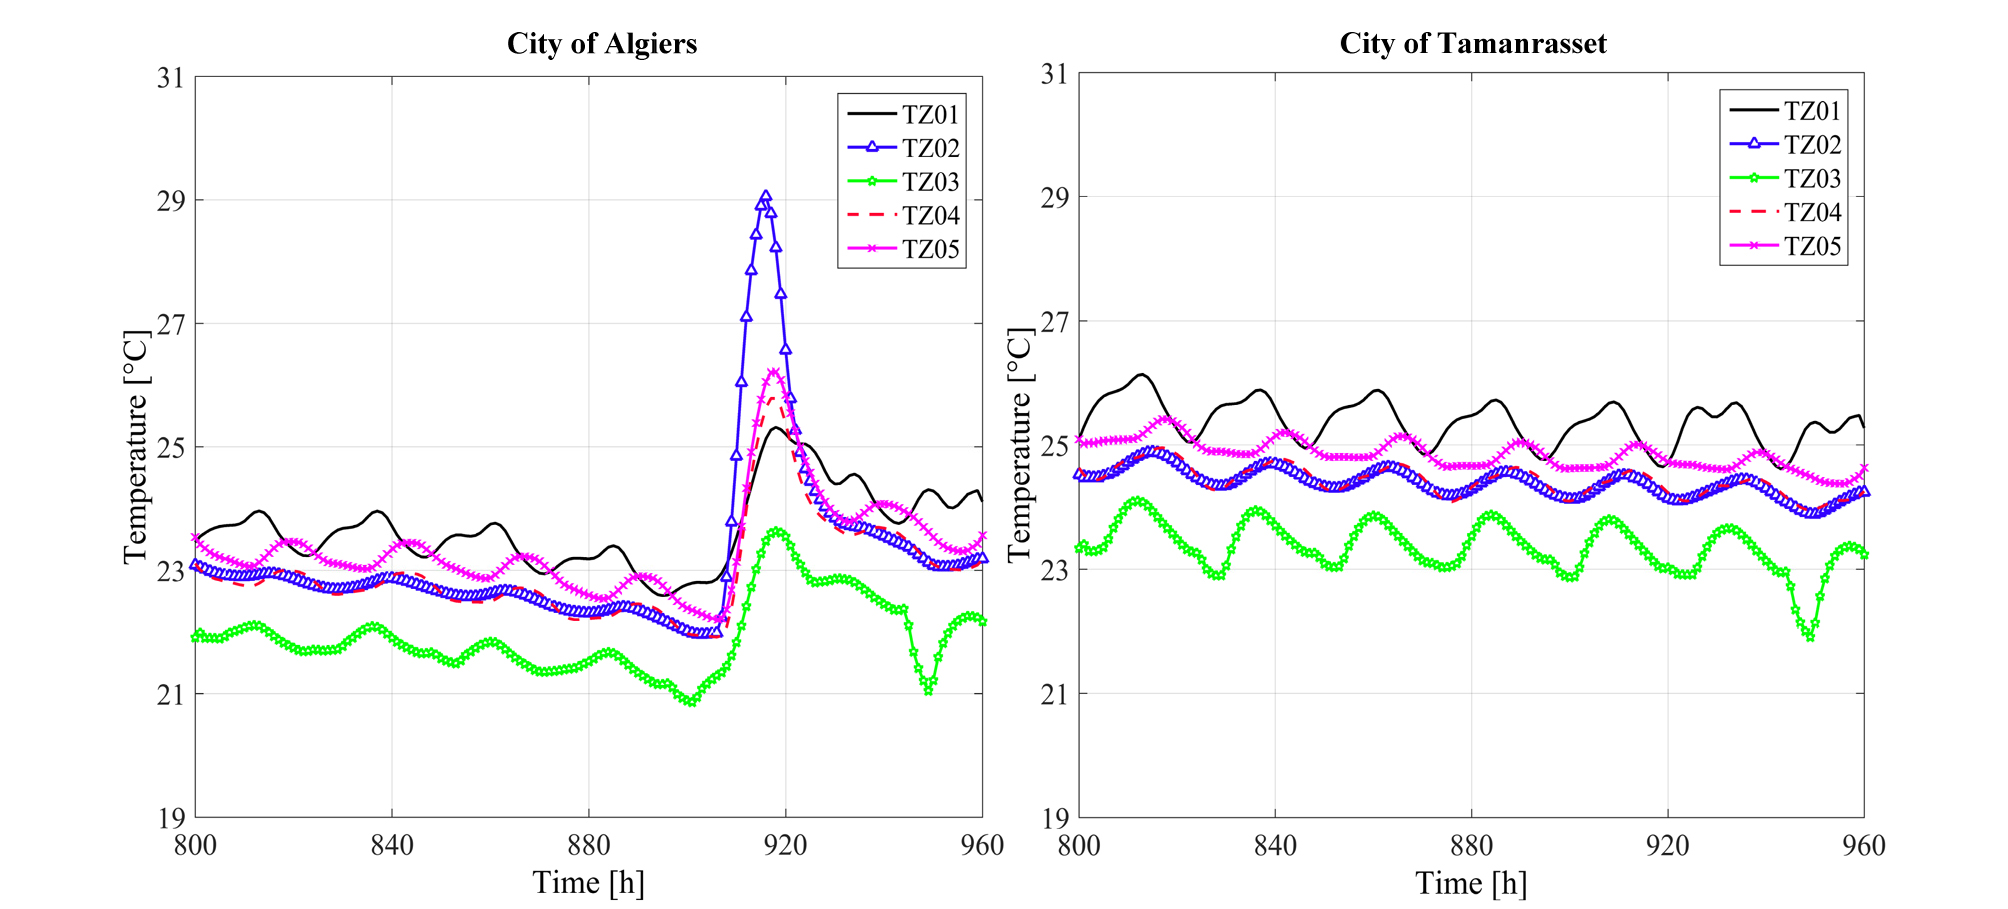
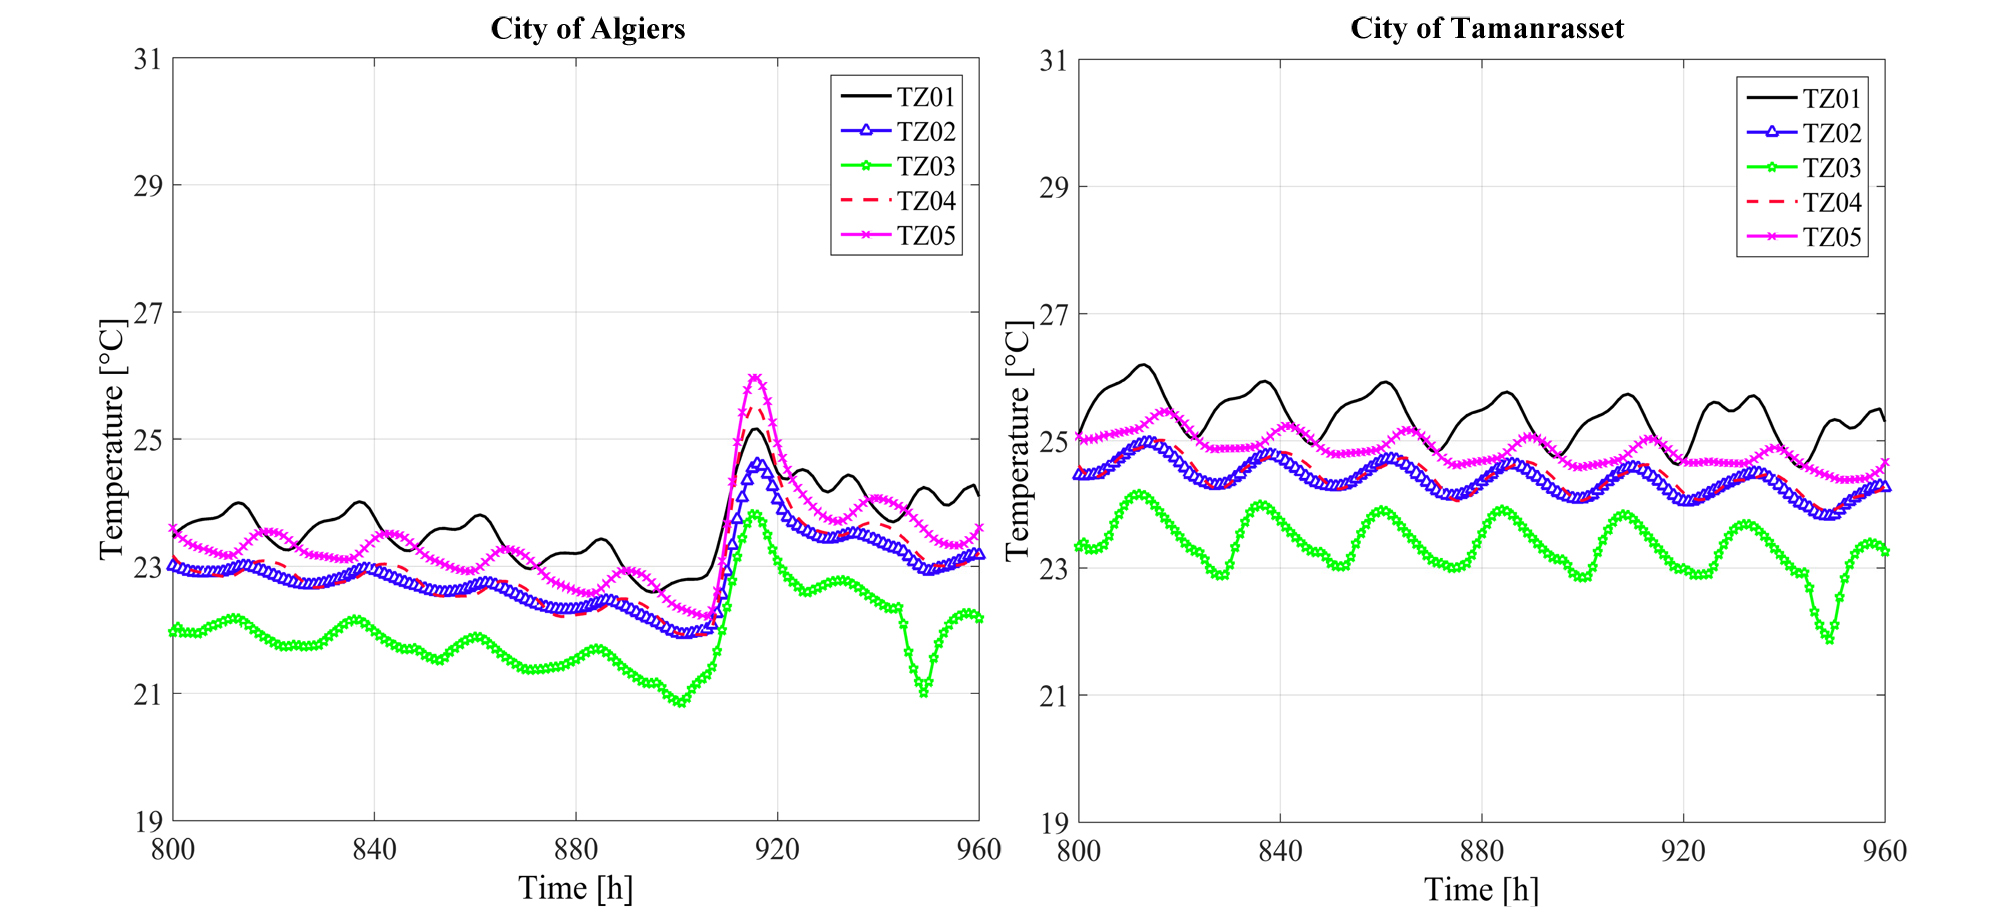
With the gas heater in the corridor, there is no control in the rooms. The heat source is not present in the rooms but it is present only in the corridor. The stove is stopped when the air temperature in zone 5 is greater than 24.5°C. The distribution of the heat produced by the equipment is achieved solely by air transfer through the doors and by conduction through the different partitions. It follows that this system tends to create a non-uniform temperature distribution in the dwelling. As an example, the temperatures in the five zones for a typical winter week are presented in Figure 8 for Algiers and Tamanrasset. Results from Bechar, which are not displayed for the sake of concision, are close to the ones observed in Algiers. The corridor (zone 2) is subject to high air temperature levels (~30°C) in order to achieve comfortable air temperature values (~21°C) in the other zones. This large temperature difference between the corridor and the other zones is caused by the fact that the air movement between zones is weak and uncontrolled.
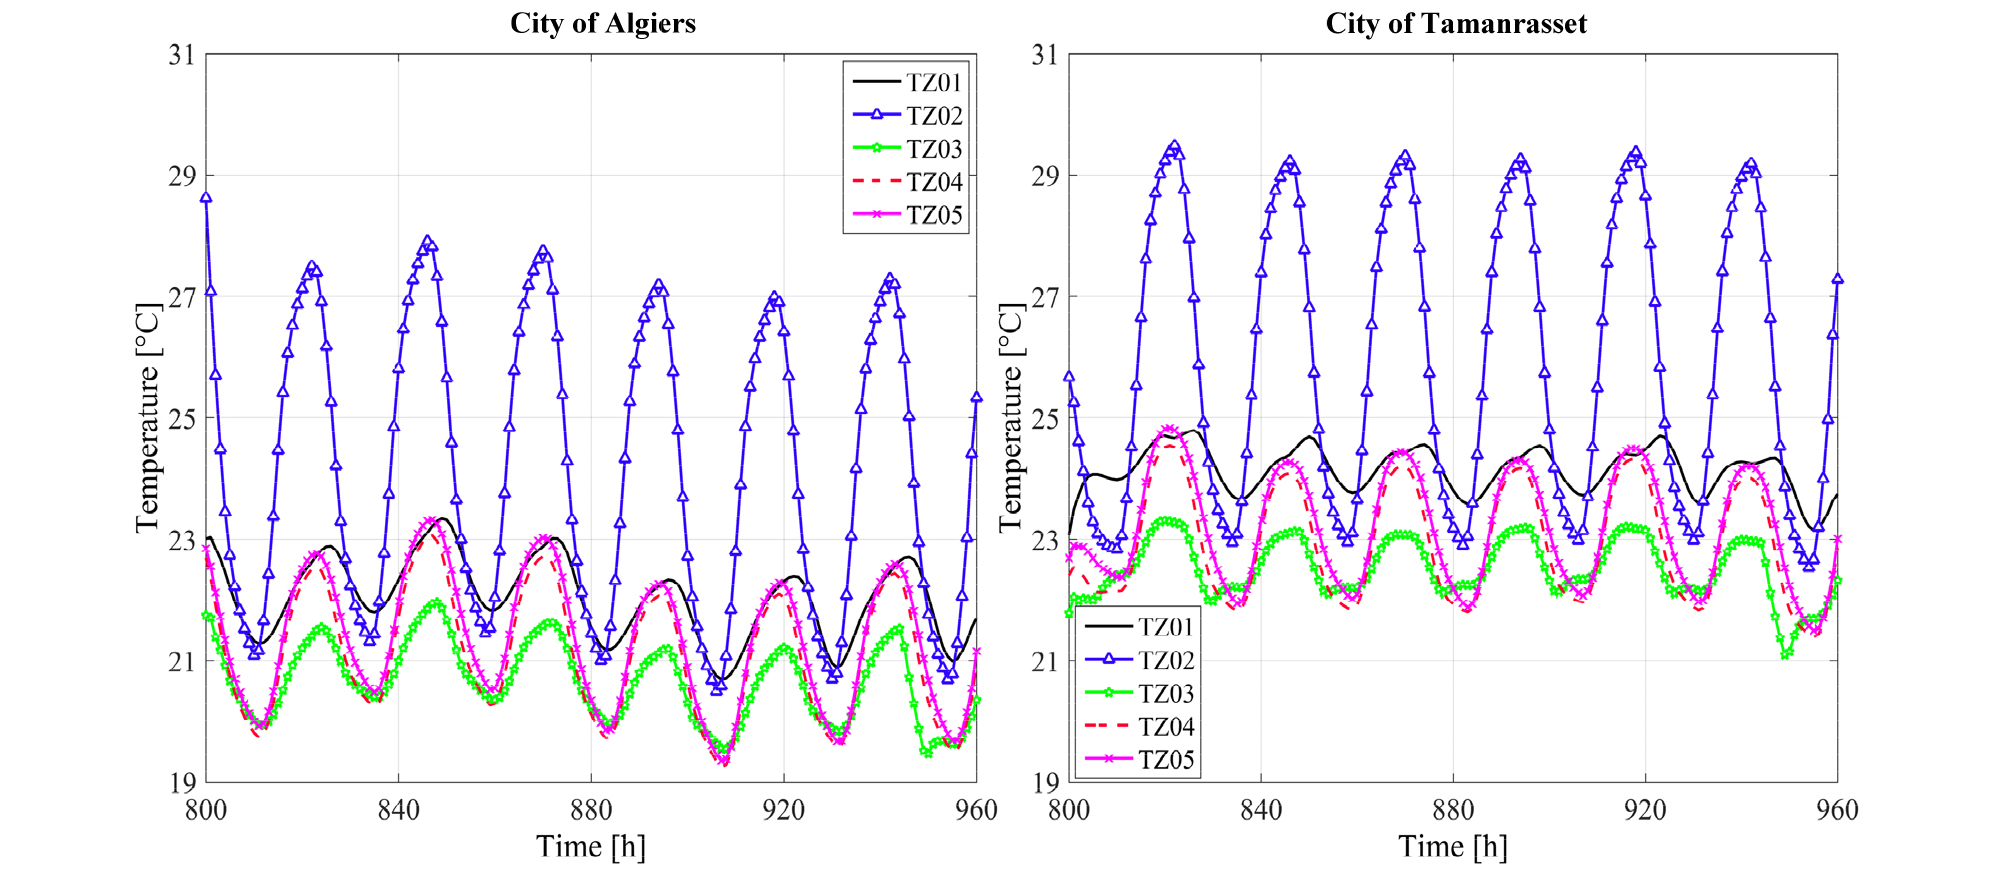
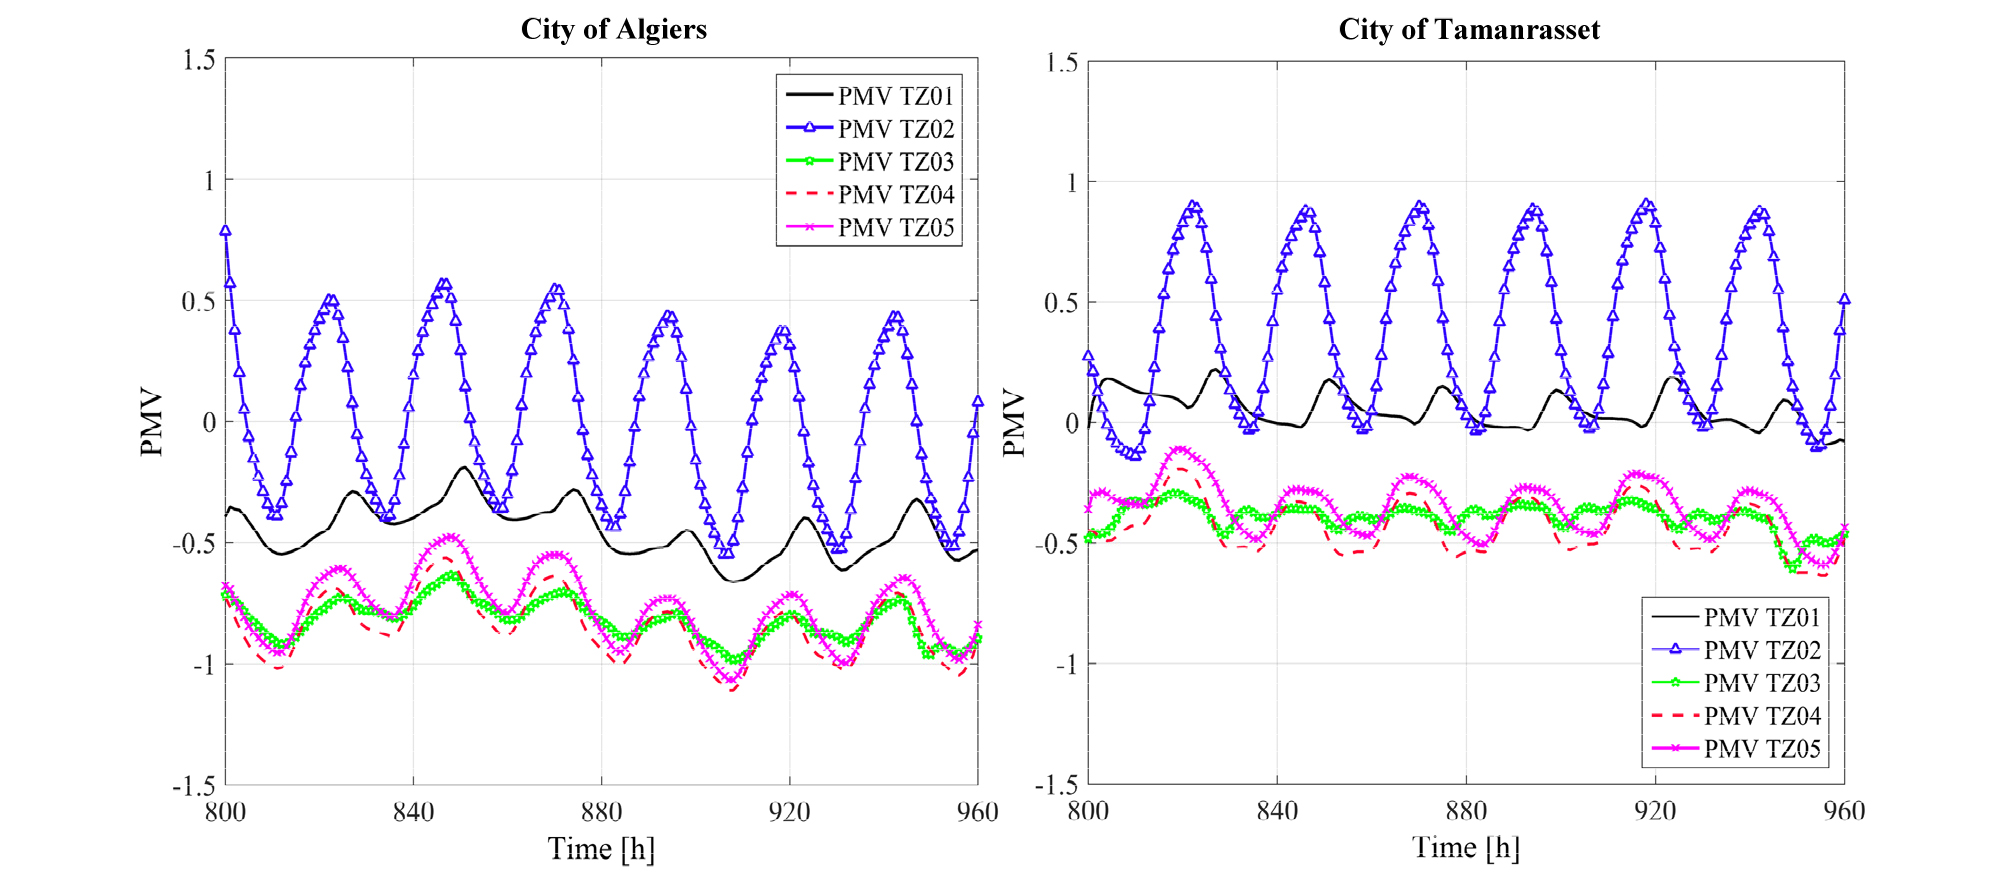
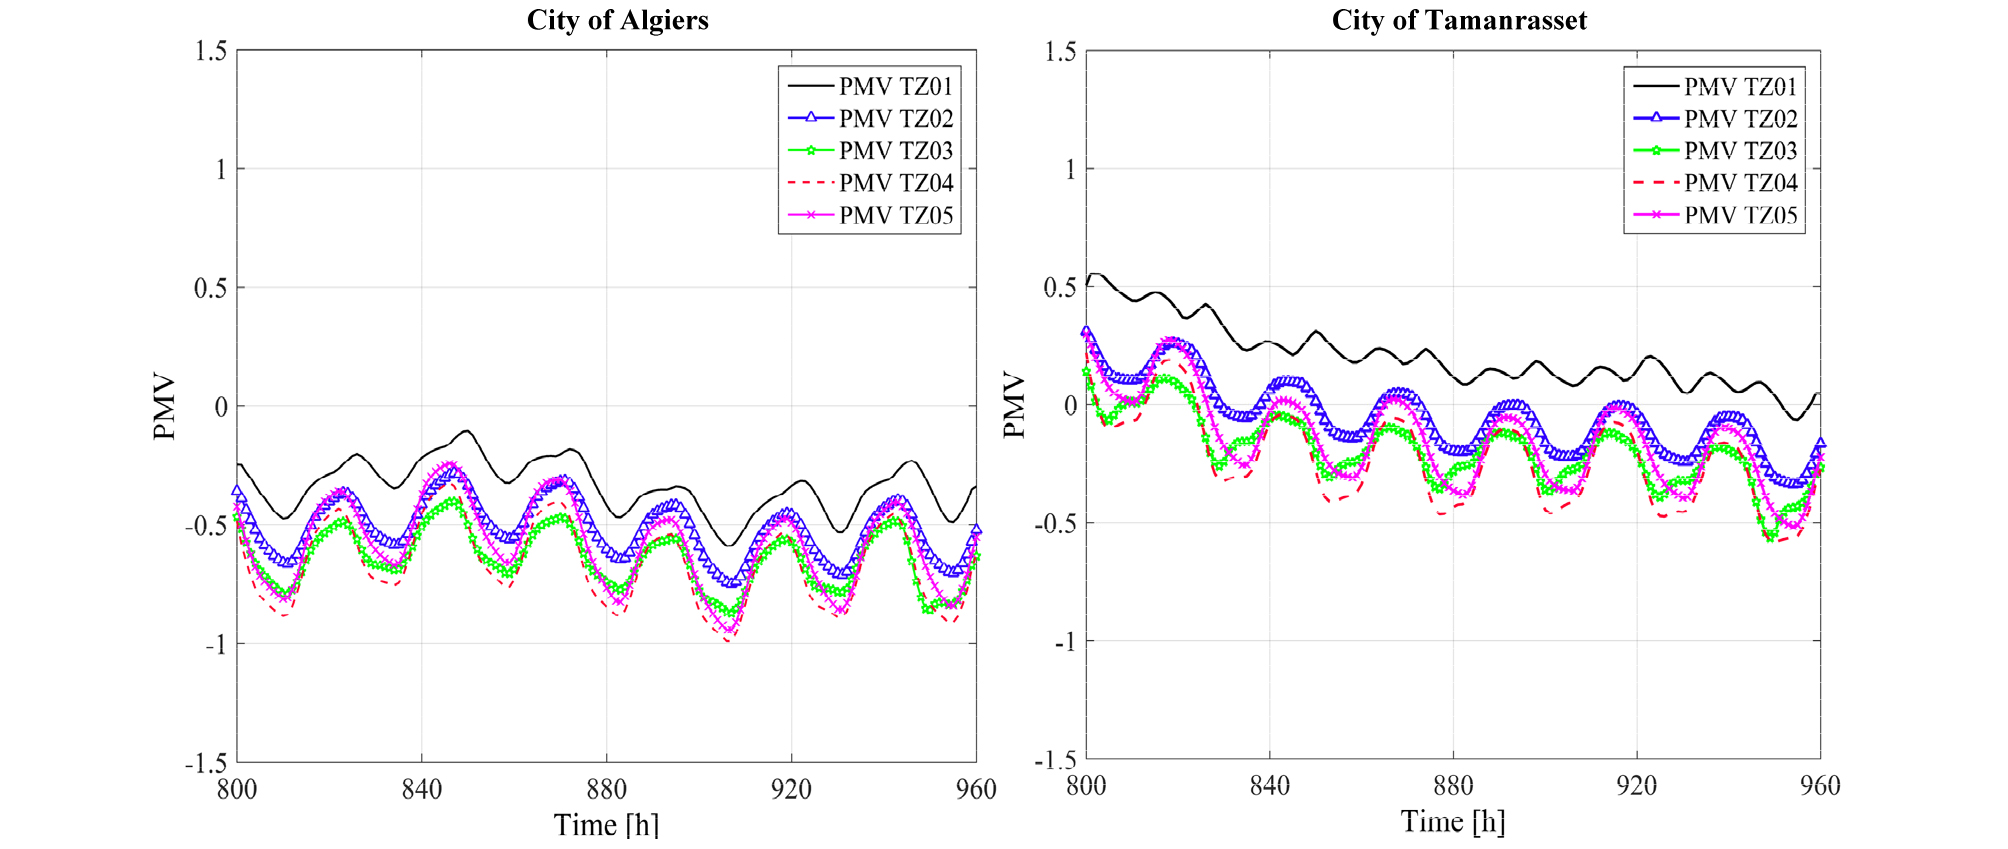
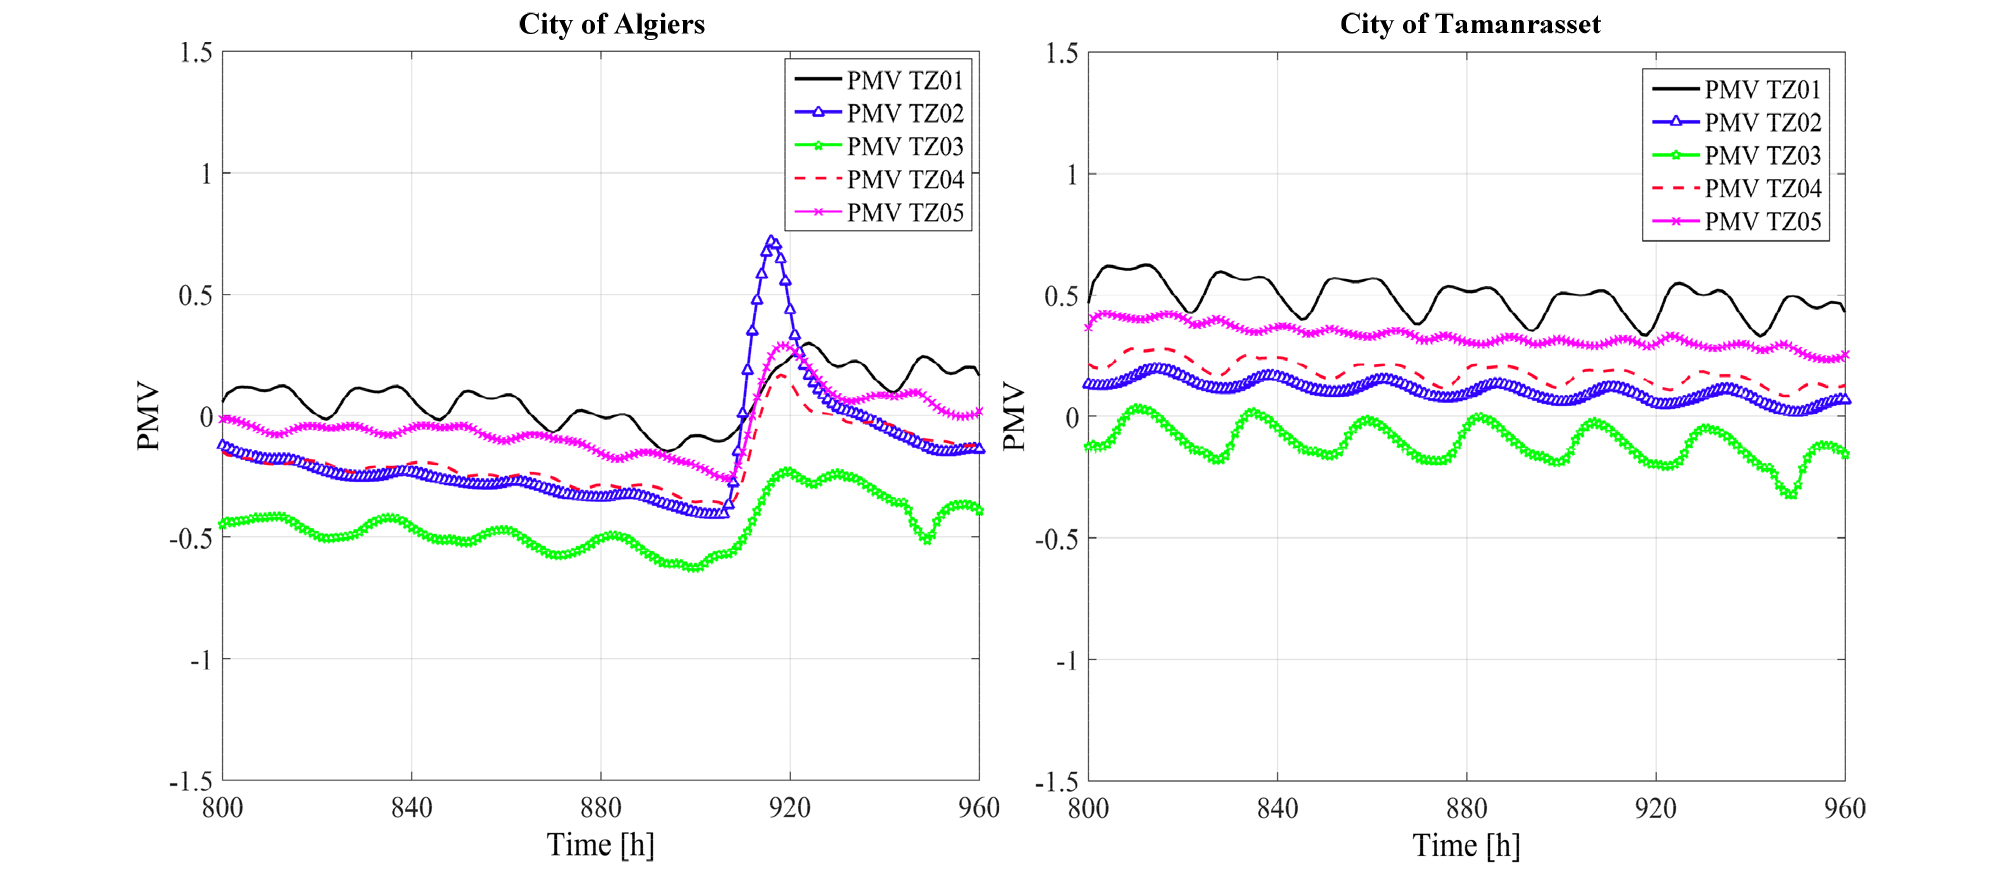
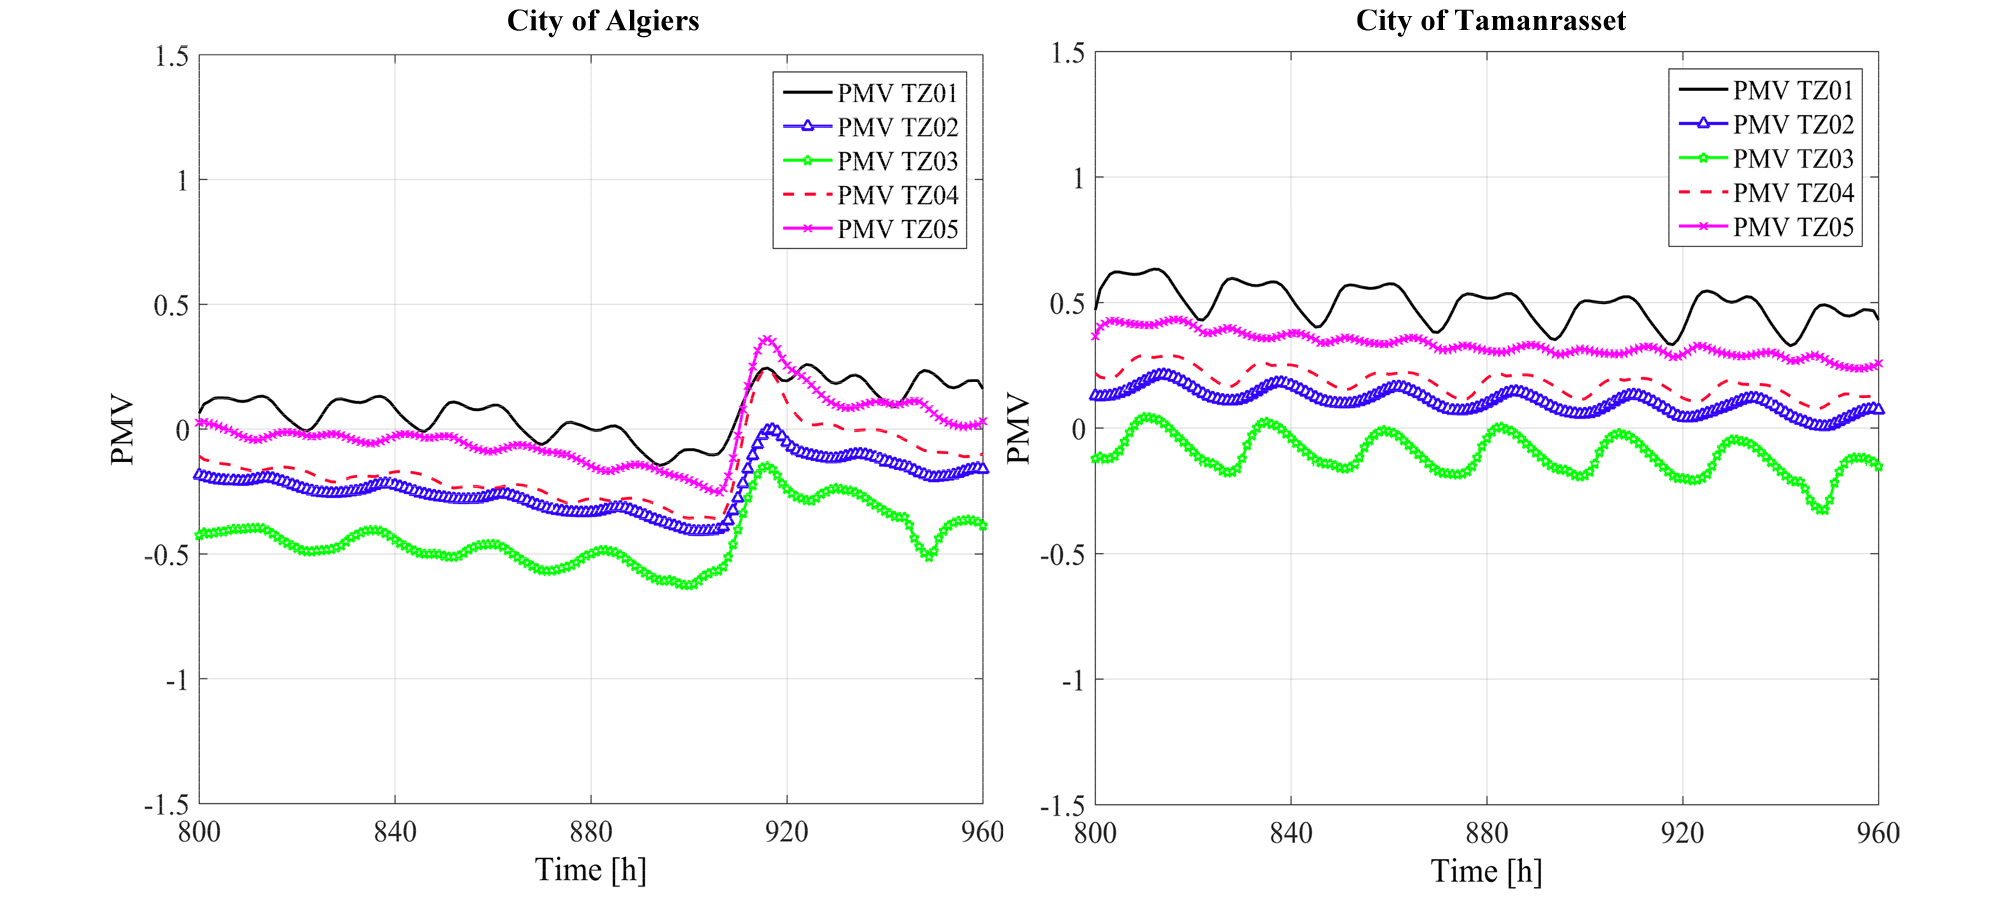
Figure 9 presents the comfort index achieved with the central gas heater system during the same week. In Algiers the PMV in the corridor is around 0.5 when the heater is turned on, and -0.5 when it is off, whereas the PMV oscillates between -1 and -0.5 in the other zones. Consequently, the indoor environment can be seen as comfortable in the corridor but too cool in the rest of the apartment. In order to achieve better thermal comfort results within this dwelling, the occupants would need to burn additional natural gas to further warm these zones, which would lead to higher energy consumption levels and increase the temperature in the corridor towards the uncomfortable range. The lack of thermal comfort in the corridor is found in Tamanrasset. Since the climate is generally warmer in Tamanrasset and there is more solar radiation, the cold wall effect observed in Algiers is less present. Consequently, PMV values are larger than in Algiers in all zones, resulting in an uncomfortable zone 2 in which the PMV goes up to 1 and is out of the comfortable range for an important proportion of time.
The second type of heating system, i.e. the one with hot water radiators, was simulated for the three locations. The resulting natural gas consumption with this new heating system is respectively 368.68 m3, 362.37 m3 and 286.71 m3 for the heating season for Algiers, Bechar and Tamanrasset. This represents a reduction of 6% for Algiers and Tamanrasset and 4% for Bechar compared to the equivalent case with the corridor gas heater system. The energy saving is essentially caused by the enhanced efficiency of this system compared to the previous one.
As for the number of hours of discomfort, it reaches across the five zones an average of 770 h, 701 h and 267 h for Algiers, Bechar and Tamanrasset, which represents reductions of discomfort set between 16 and 37% when compared to the results obtained with the corridor gas heater. It is thus visible that the system with radiators provides benefits in terms of comfort and energy consumption in the three Algerian locations that were simulated.
For the sake of comparison, Figure 10 presents the temperature of each zone of the dwelling in Algiers and in Tamanrasset for the same typical winter week when using the hot water radiators. A more stable and uniform temperature is achieved everywhere in the dwelling, without high temperatures in the corridor as in the previous scenario. PMV is also reported in Figure 11 as a function of time for the same week. Although improvement is visible, discomfort is still present in the Algiers dwelling. It is interesting to note that for similar temperatures (between 20°C and 23.5°C), the apartment in Algiers has higher PMV values with the radiators system than with those observed in zone 1, 3, 4 and 5 with the central gas heater. This can be explained by the fact that the radiators warms the walls in addition of the air, which is a desirable effect for this dwelling considering the problem of the cold walls in the reference apartment.
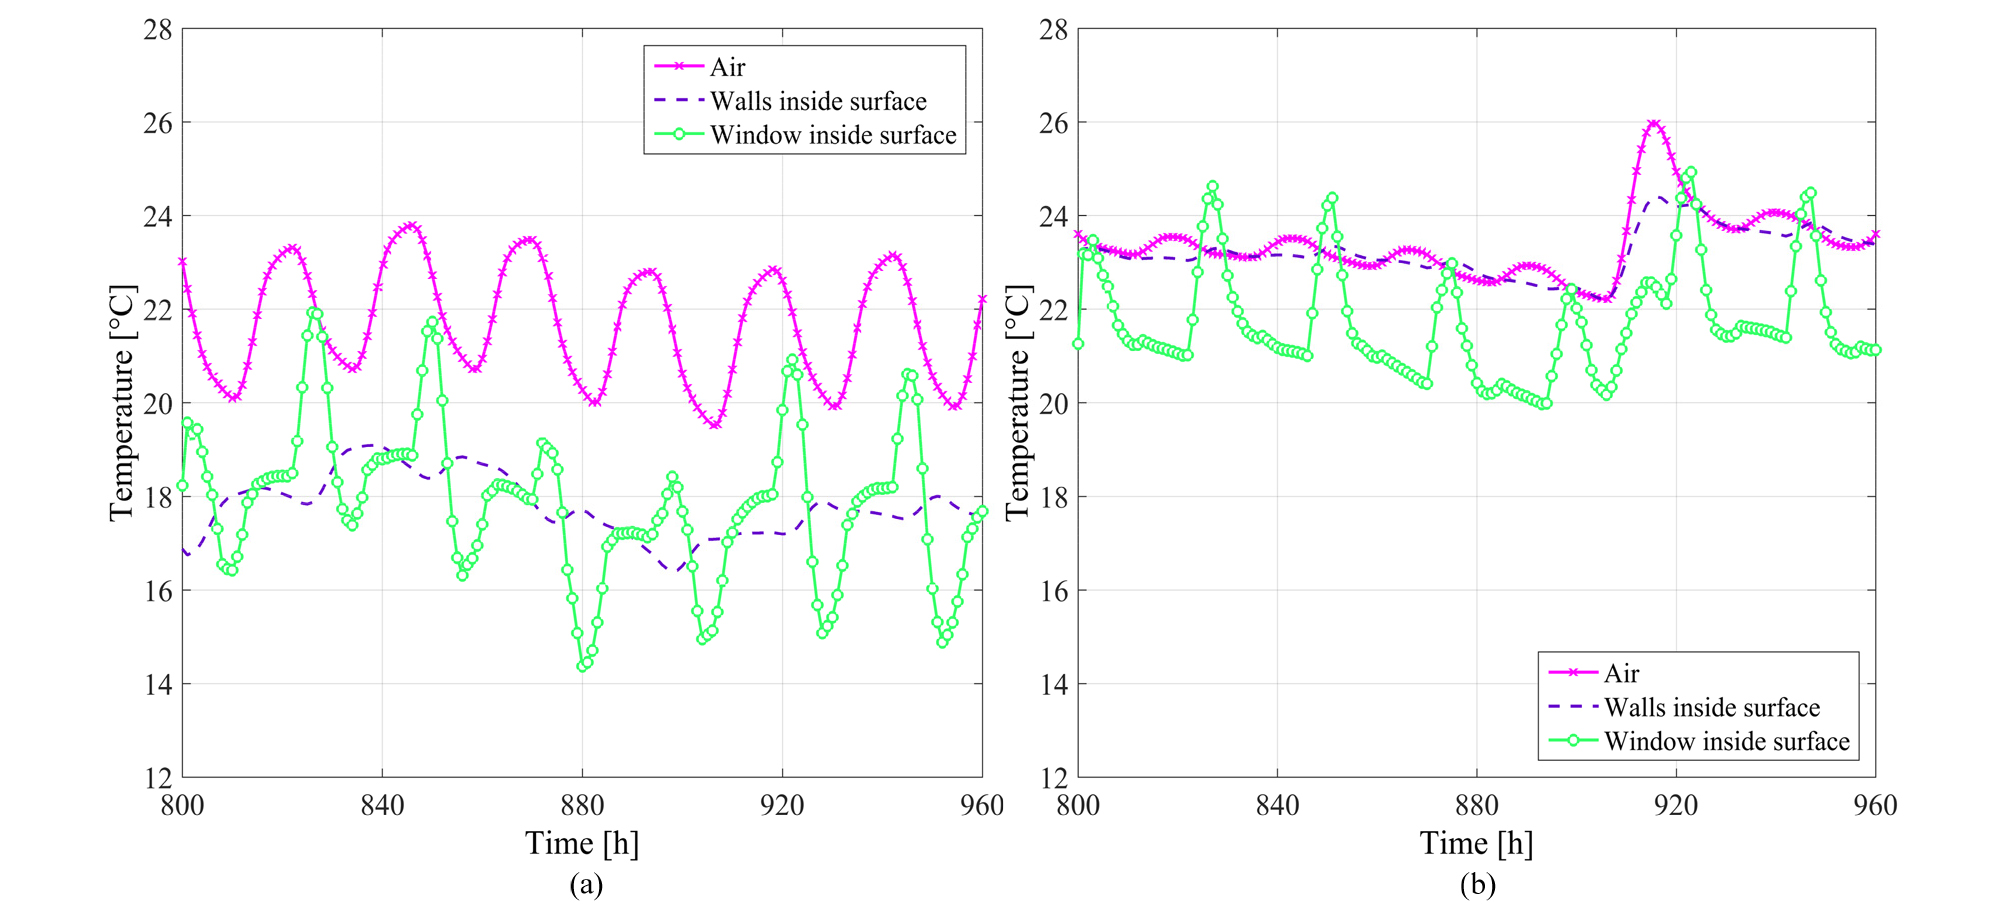
Thermal discomfort was found to be related to some extent to the low temperature of the internal surface of the wall and of the windows since the PMV parameter is not only affected by air temperature, but also by the surrounding surface temperature. Figure 12a shows that when using the reference wall assemblies and windows, the surface temperatures of both walls and windows are considerably below the indoor temperature. The temperature of the internal surface of the exterior wall can be as low as 6°C below the air temperature. A temperature difference between the air and surfaces (e.g., walls, windows, doors, etc.) superior to 3°C is known to introduce discomfort [41]. The lack of insulation in the walls and the poor quality of the windows provoke a cold wall effect that cause occupants to perceive the indoor environment as cold is spite of an appropriate air temperature and high level of clothing. Furthermore, the reference wall assemblies and windows generate high thermal losses through the dwelling envelope, which explained why the energy intensity was relatively high. These observations motivated the analysis of envelope rehabilitation.
Energy consumption and thermal comfort after the rehabilitation
As shown in Figure 13, improving the wall assembly with the addition of an air layer and of hollow bricks (See Figure 7b) reduced the gas consumption by roughly 100 m3 of gas for all cities and for both types of heating systems. Replacing single-glazing windows by double-glazing ones can then further reduce gas demand by 100 m3 for a total reduction of approximately 200 m3 of gas from the most insulated enveloped to the reference envelope. It was found that the introduction of an air gap within the wall assembly does reduce the energy needs of the dwelling, but that the thickness of this air gap (i.e., 2 versus 5 cm) has virtually no impact on the heating need. For instance, in the apartment in Algiers with single-glazed windows, the gas consumption is 307.2 m3 with a 2 cm air gap versus 299.52 m3 for a 5-cm air gap with the reference heating system.
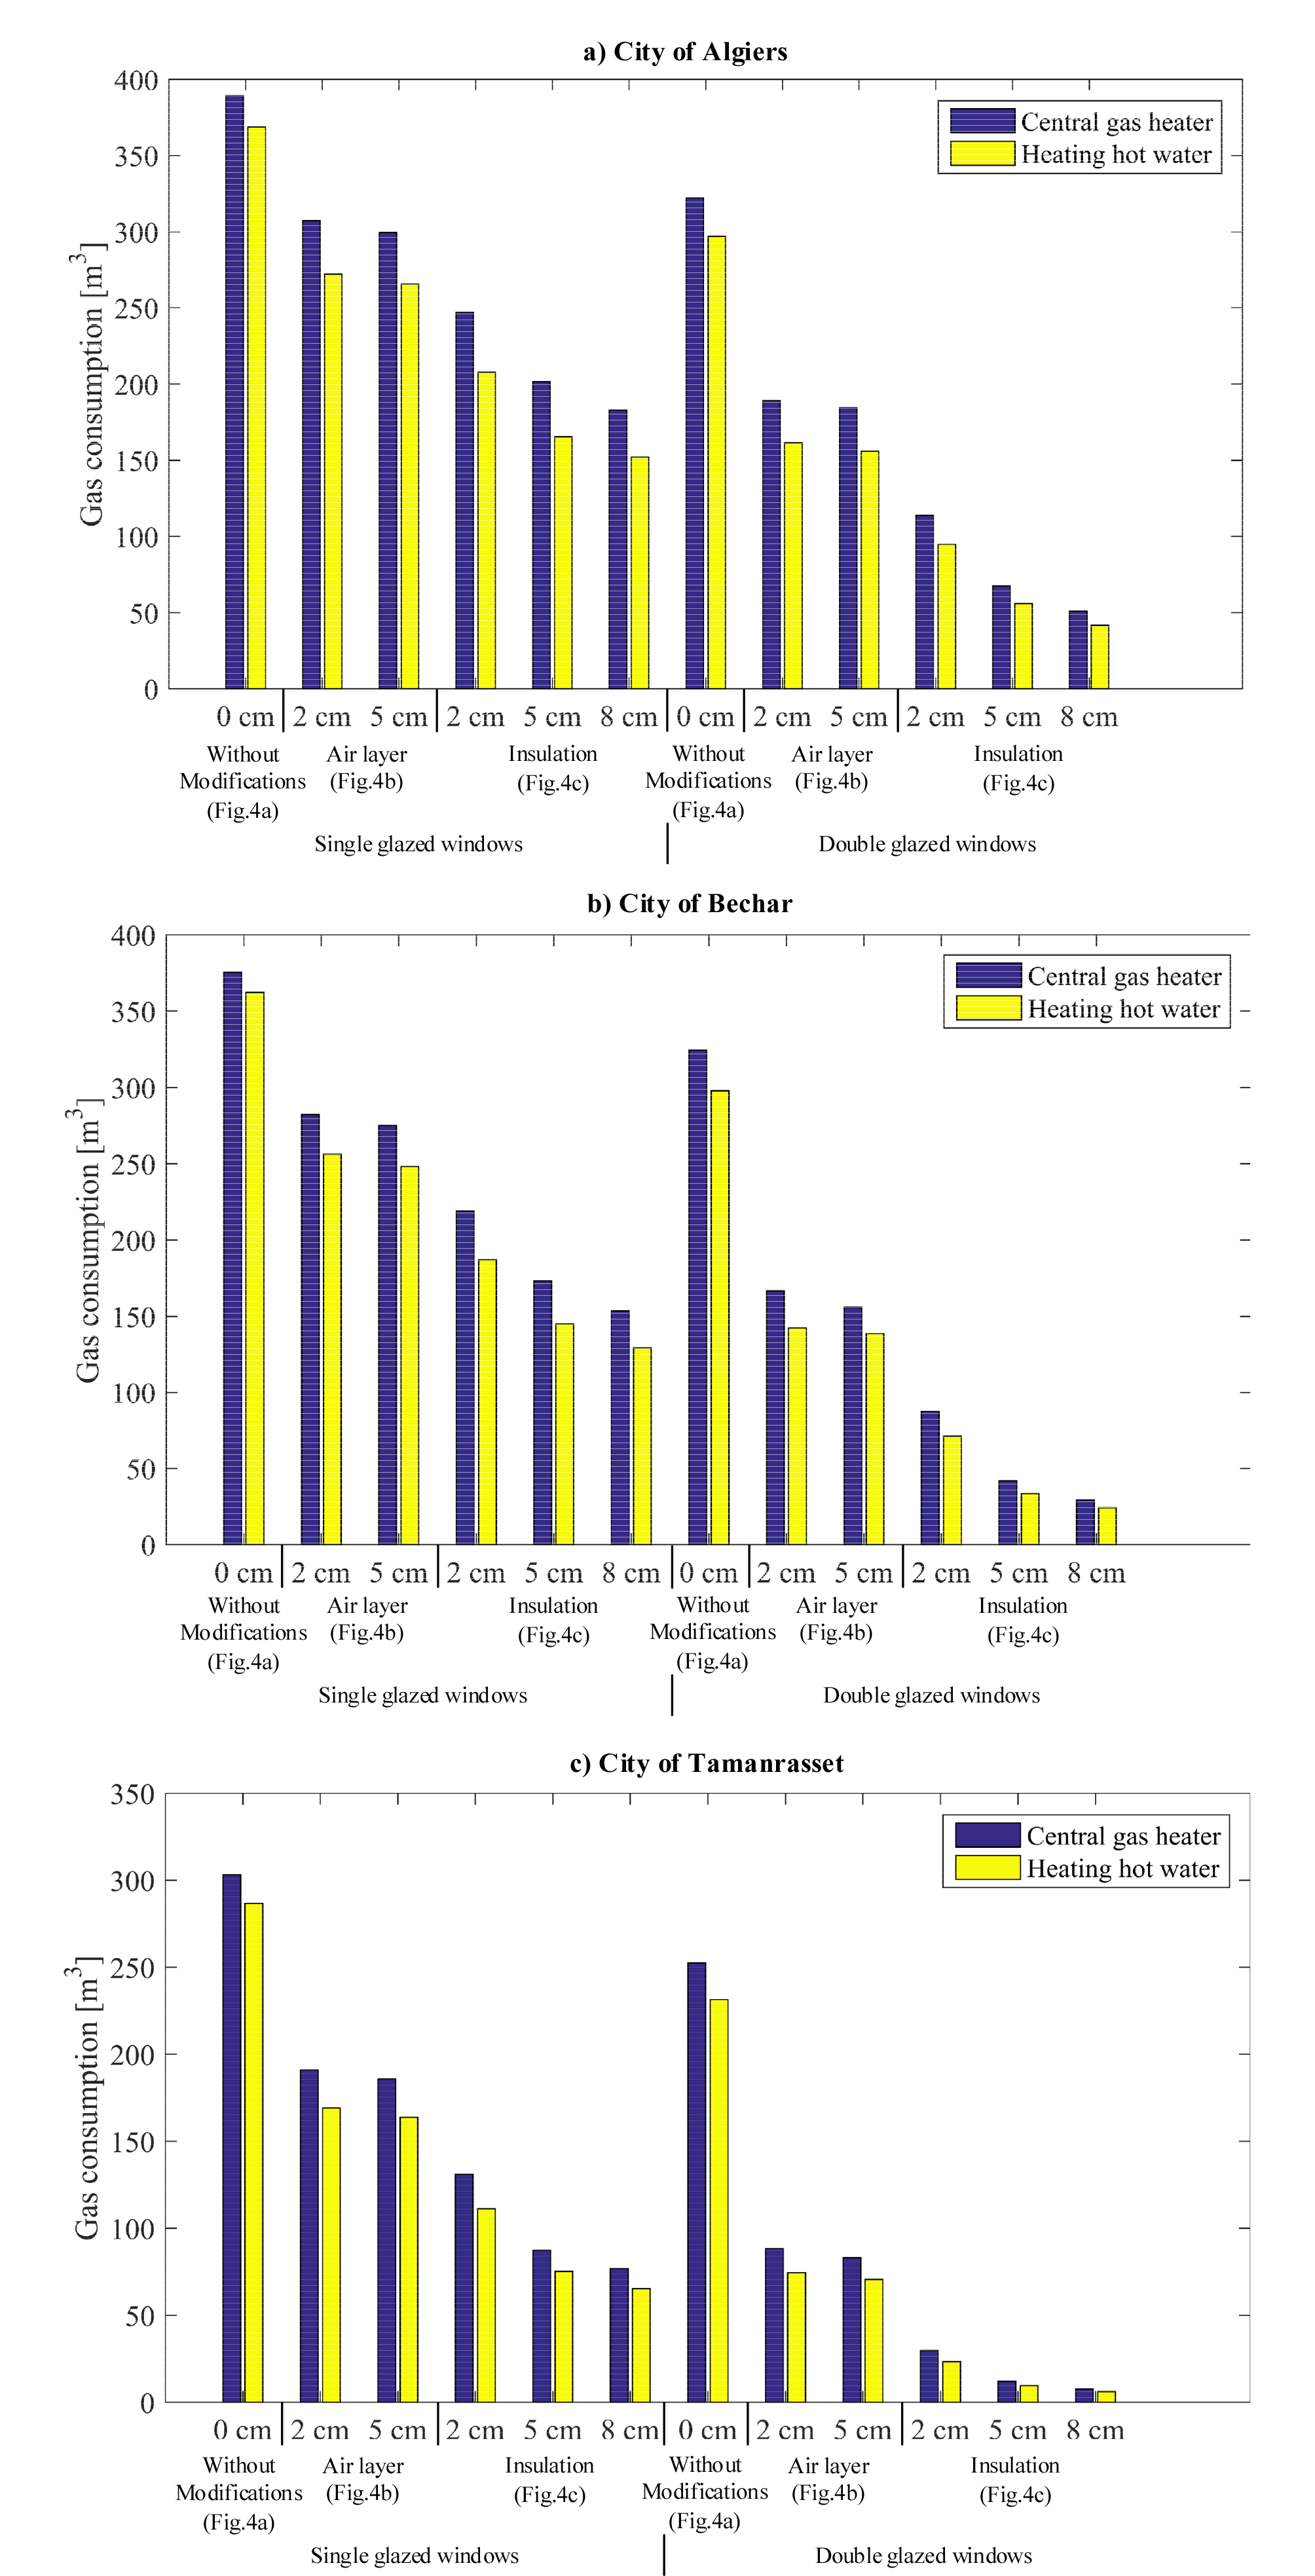
As for the wall assembly of Figure 7c with insulation and hollow bricks, it reduced the energy consumption even further, allowing to reach approximately half of the original gas consumption. A similar conclusion can be reached for the introduction of insulation. It is shown in Figure 13 that increasing the insulation thickness to 8 cm did not cut down significantly the energy consumption compared to the 5 cm insulation scenarios. Further, it is noticed, that changing the heating system in the studied dwellings, from the central gas heater to the hot water radiators, leads to a reduction of approximately 5% of gas consumption whatever the envelope performance.
With improved envelopes, the number of hours of discomfort dropped significantly, as can be seen in Figure 14. With the corridor heater, zone #2 of the dwelling remains relatively uncomfortable for all climates, wall assemblies and window types. This discomfort is essentially eliminated with the hot water radiators in all cities when using the appropriate envelope. Discomfort is highly sensitive to the choice of the envelope. When using the central gas heater, reductions of the average number of hours of discomfort observed across the five zones of the dwelling can go up to 70% in Algiers, 62% in Bechar and 75% in Tamanrasset depending of the envelope. For dwellings that employ hot water radiators, these figures are respectively 91%, 84% and 94%.
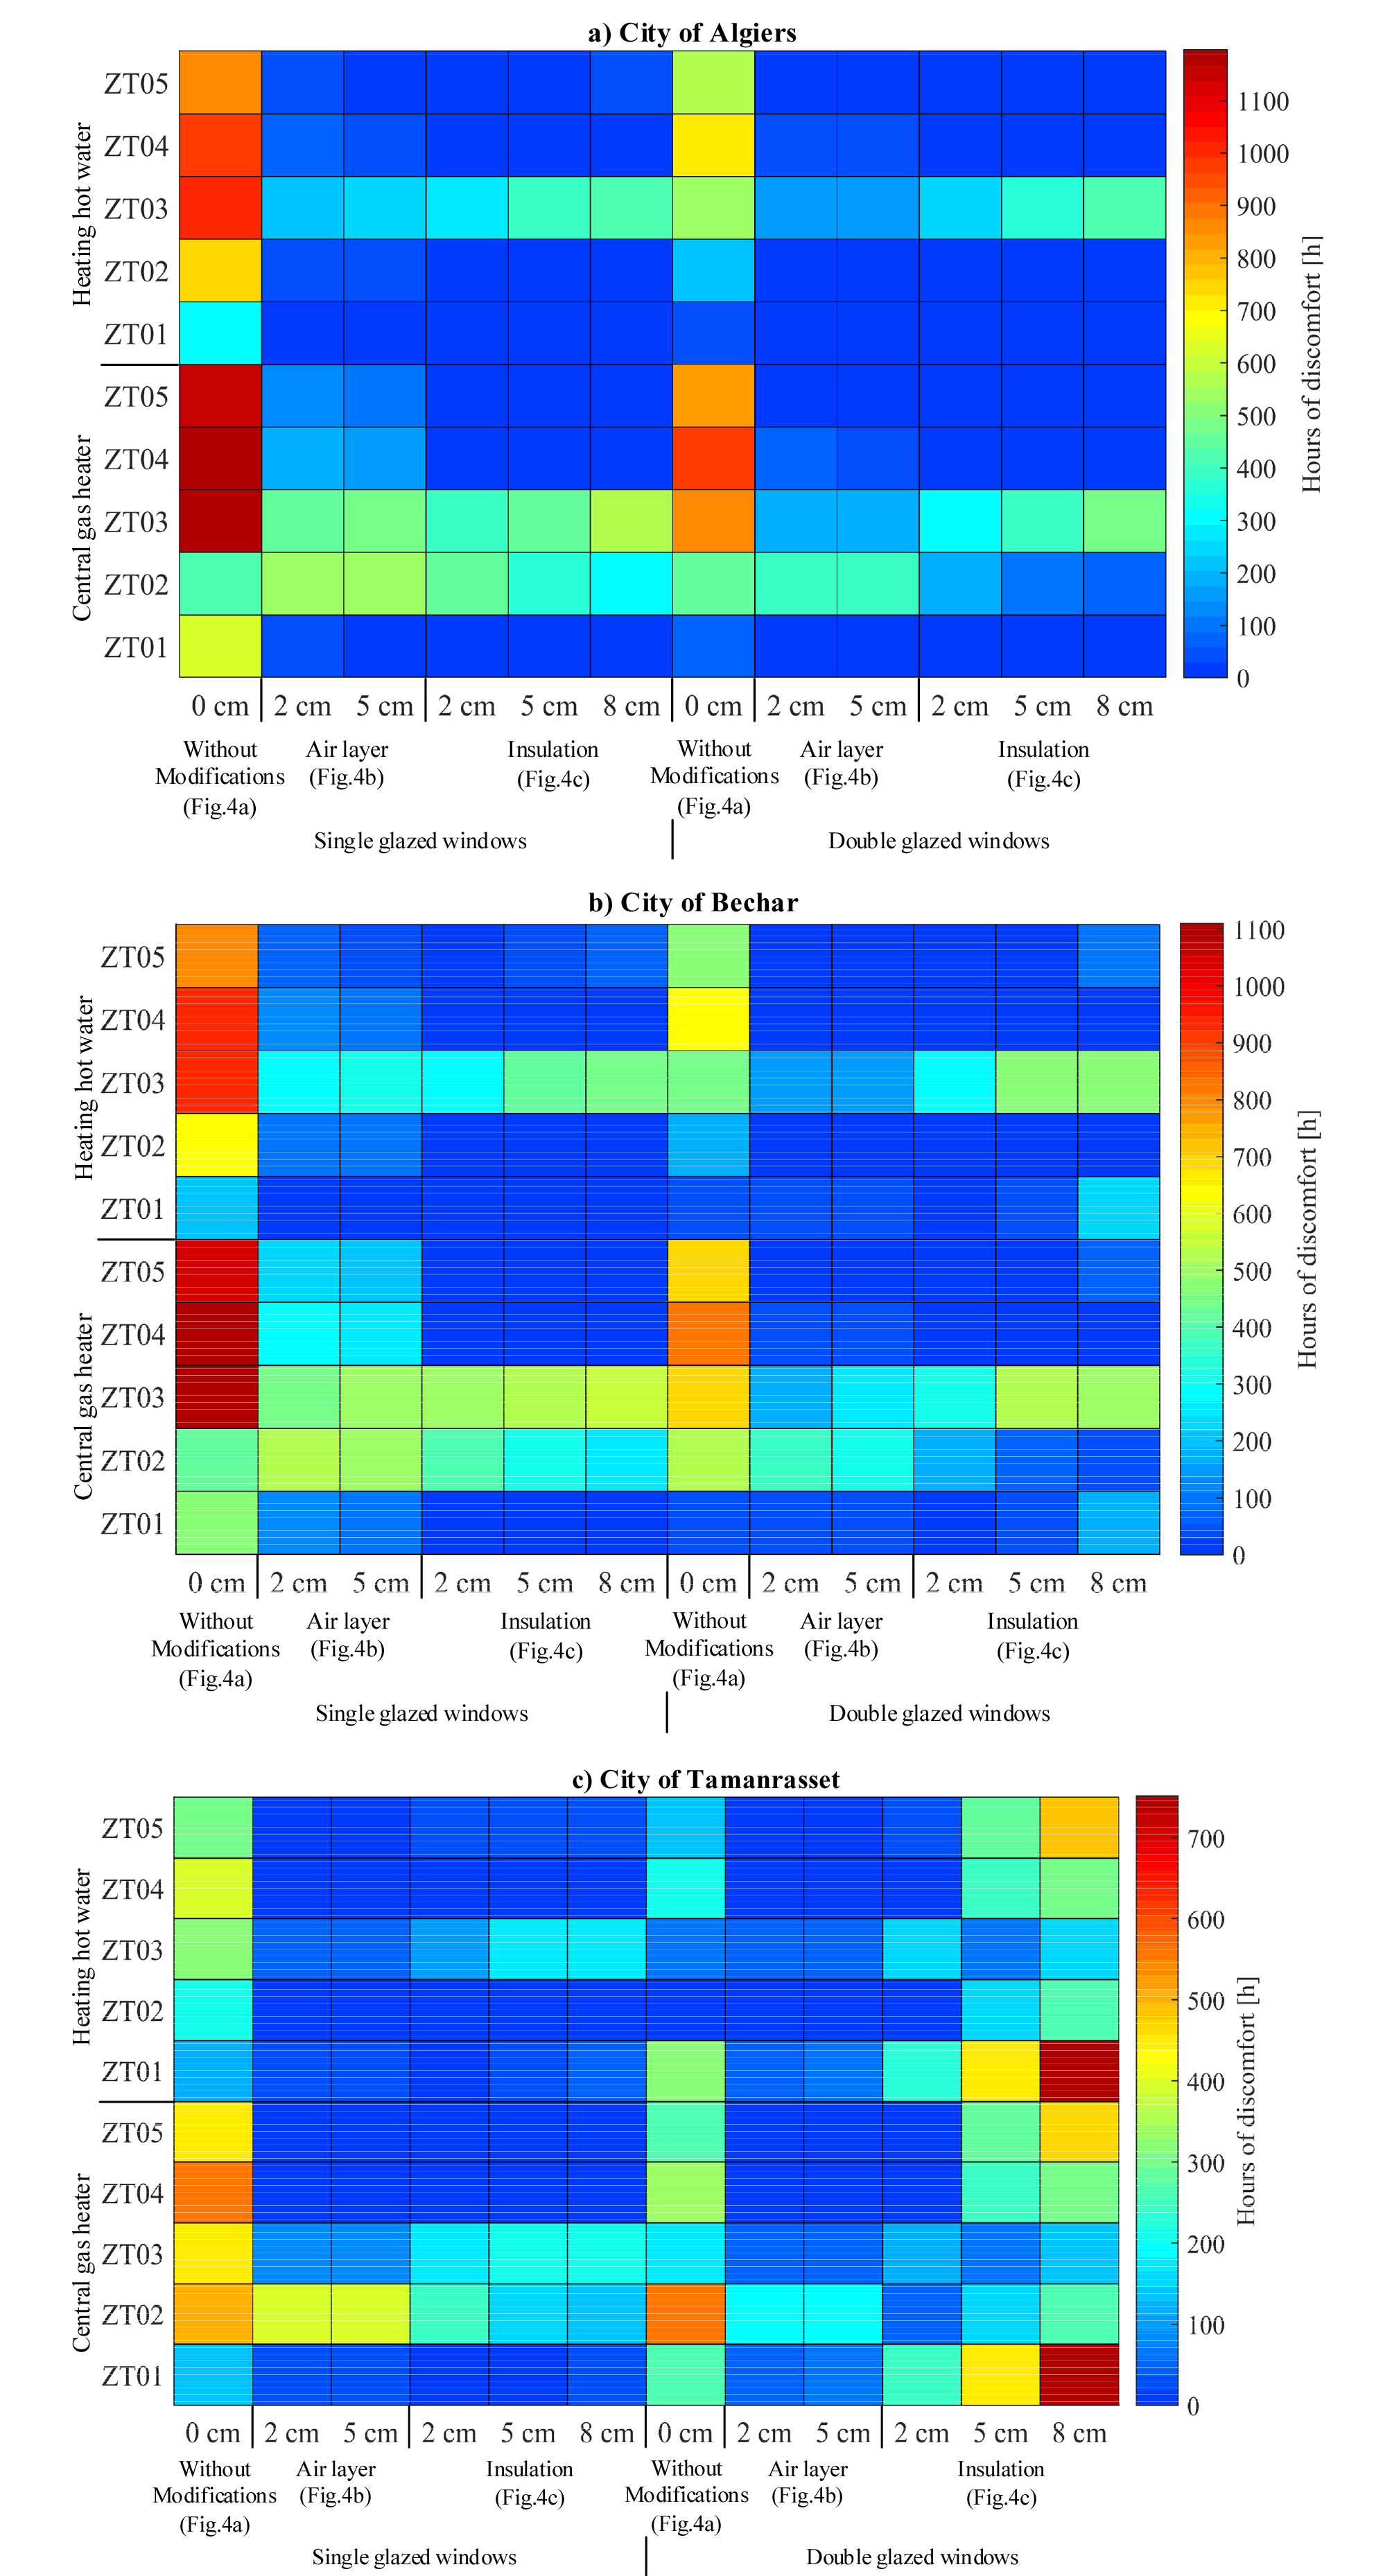
The most insulated envelopes (last three columns of right in the graphs of Figure 14) appear to lead to more discomfort in the apartment than more balanced envelope. This observation is particularly true for Tamanrasset, where the living room is not comfortable for most of the simulation period in the most insulated dwelling. The addition of insulation increasing discomfort suggests that even in winter there are overheating problems in these apartments, where heat introduced in the dwelling via internal heat gains and solar radiation is trapped indoor. This explains why Tamanrasset, the city with the warmest climate, suffers more from this issue than the other two cities. Therefore, from a comfort standpoint, the optimal level of insulation is not the maximal one, but a more balanced level that allows a sufficient amount of heat to be evacuated from the dwelling without causing an important increase in heat consumption. This optimal level should change according to the climate where the building is located, with warmer climates having optimal thicknesses of insulation that are smaller than those in colder climates. It is important to note that a modified control of the heating system and more window opening would help to achieve an acceptable level of comfort for dwellings that are too insulated. It is also likely that occupants would dress differently in that case, in such a way the assumption of 1.2 might not be good for that situation.
To better illustrate the balance between energy consumption and thermal comfort, Figure 15 provides as a scatter plot the performance of each of the 72 simulations for these two variables. In the figure, each scatter point is shaped according to its location (Algiers = circle, Bechar = square, Tamanrasset = triangle), sized according to its window type (Simple glazing = small markers, Double glazing = large markers) and colored according to its wall assembly. Unfilled markers are those obtained with the central gas heater and filled ones represent the performances of the hot water radiators. The optimal design should yield minimal energy demand and minimal discomfort, so it should be located in the bottom-left corner of Figure 15. In Algiers, there is one design that reaches this part of the graph – the one that has 8 cm of insulation with double-glazed windows and hot water radiators. The optimal design has 5 cm of insulation in Bechar and only 2 cm in Tamanrasset, again showing that the optimal level of insulation depends on the climate. In Figure 15, the less comfortable dwellings are also those who are the most dependent on gas. These are the ones that are the closest to the reference dwelling (low-level of insulation, simple glazing and central gas heater). Thermal rehabilitation in poorly designed buildings yields great improvements for both gas consumption and thermal comfort, until the gas consumption goes below 250 m3. Below this value of consumption, rehabilitation still reduces gas consumption, but it has minimal impact on thermal comfort (discomfort reduces at a small rate). This is true up to a point of approximately 70 m3 of gas consumption where the reduction of energy demand comes at the cost of increasing the risk of overheating. It should be mentioned that a new control strategy for the heating system that is more appropriate for the improved building envelopes might reduce discomfort. Since the walls are now more insulated, their temperature is increased and thus a lower temperature is required for indoor air to reach comfortable conditions. In retrofitted dwellings, it could thus be preferable to maintain the indoor environment between 19 to 22.5°C instead of the 21 to 24.5°C range that is used in the simulations. However, in some cases, such as the simulation in Tamanrasset with the more insulated building envelope, there is relatively high overheating even if there is nearly no use of the heating system (natural gas consumption is minimal), so the overheating problem is not created by a non-optimal control strategy in these cases. It is also worth to mention that occupants might adapt their behavior to reduce overheating, for example by opening the windows more often or using lighter clothes. The modeling of these changes was not attempted here, but could be the object of future investigations.
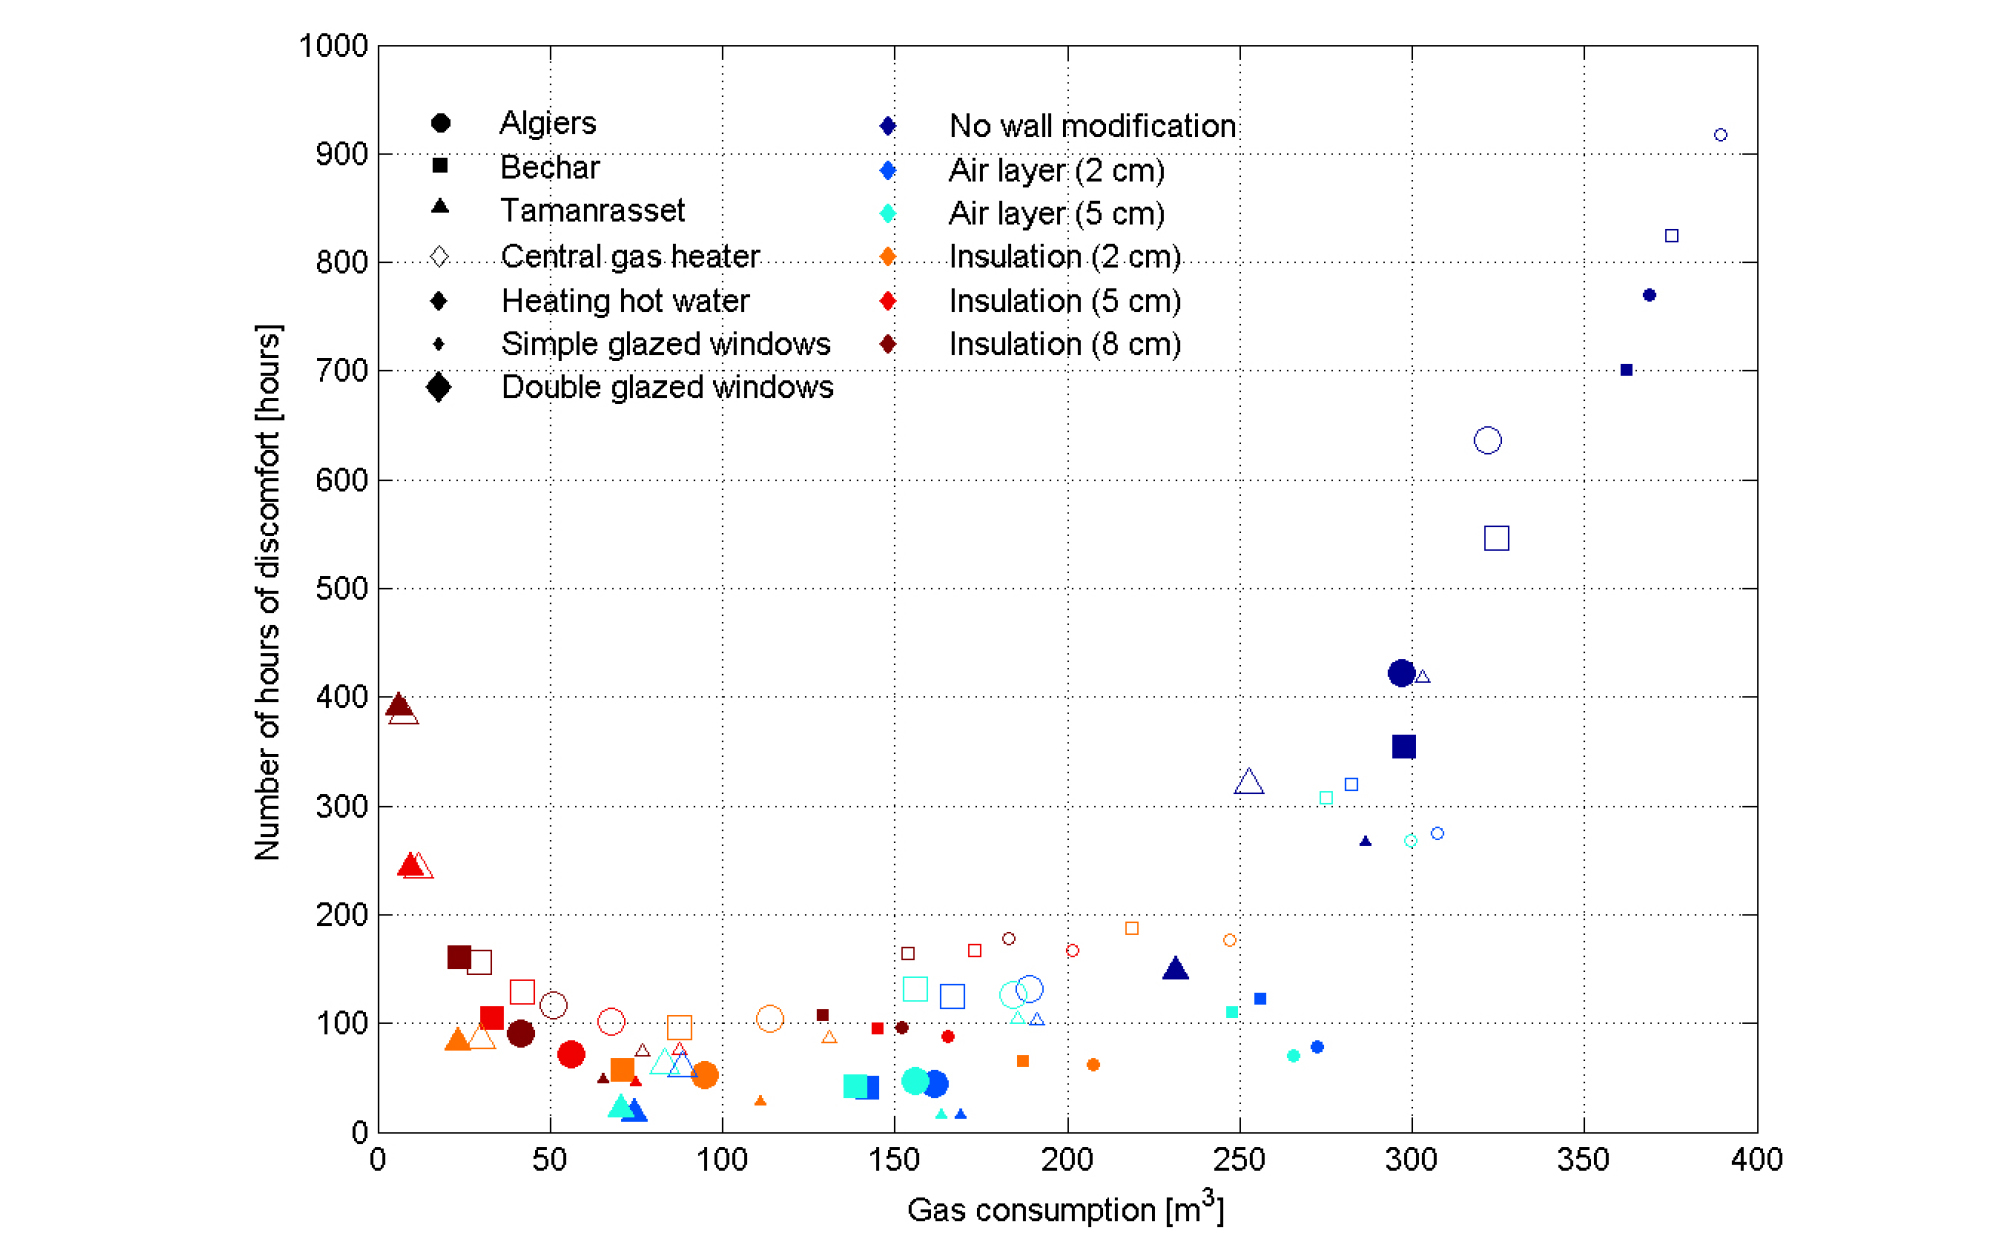
Figure 16 displays the temperature evolution in all five zones during a typical week for the design that has an insulation thickness of 5 cm with double-glazed windows, but with the reference heating system of the central gas heater. The comfort for the same week and design is shown in Figure 17. These two figures can be considered as a parallel with Figures 8 and 9, which draw the same variables but for the reference dwelling. Figures 16 and 17 demonstrate that the thermal rehabilitation of the dwelling reduced the temperature fluctuations in zone #2 for both Algiers and Tamanrasset – the temperature is more uniform over all rooms even when using the central gas heater strategy to heat the apartment. With a more insulated envelope, heat that goes from the corridor (zone #2) to the other zones tends to stay in these zones instead of going out of the dwelling through its envelope. Consequently, the heater in zone #2 is less often used and spikes of temperature in this zone are rarer (but still possible as can be seen in Algiers in Figure 16). Figure 17 confirms the improvements in thermal comfort since PMV indexes are mostly within the acceptable range of -0.5 to 0.5. However, in Tamanrasset, it seems that the indoor environment in zone #1 (living room) is just above the acceptable range, confirming that adding too much insulation in the envelope can lead to overheating.
The same exercise was repeated for dwellings that employ hot water radiators for space heating. The temperature curves and PMV indexes for the dwellings with 5-cm insulation and double-glazed windows are respectively found in Figures 18 and 19. These figures are very similar to the ones displayed in Figures 16 and 17, which indicates that the switch from a heating system to another has a smaller impact on thermal comfort for high-performance dwellings than for the reference dwelling where the switch greatly attenuates the spikes of temperature in zone #2. Nonetheless, the spike of temperature between the 910th and 920th hours (maximal temperature of ~26°C) is considerably smaller with the radiators than with the central heater where the temperature reaches up to ~29°C. This prevented the indoor environment from going out of acceptable PMV values. Overheating in zone #1 in Tamanrasset remains a problem with the hot water radiators.
A major problem found earlier about the reference building is the presence of a cold wall effect in which the lack of insulation in the envelope drastically reduces radiant surface temperatures inside the dwelling and thus contributes to an environment that feels cold for occupants in spite of the appropriate air temperature. The temperature of inside surface of the non-insulated walls and of single-glazed windows is about 3-4°C below the indoor air temperature. After rehabilitation, the wall’s temperature now matches the air temperature and the windows temperature is only ~1°C below (see Figure 12b). This increase in wall and window temperatures makes it easier to provide a comfortable indoor environment to the occupants without overconsuming energy.
Conclusions
This paper aims to study the energy performance of multiple designs of an apartment for three different Algerian cities (Algiers, Bechar, Tamanrasset) in different climates. In particular, the performance of two widely used heating systems (one using a central gas heater and the other relying on hot water radiators) was studied. This study was done by creating a numerical model of a case-study apartment in Algiers that has a central heater in its corridor. Temperature and energy data of this apartment was previously recorded over a heating season. This model could then be validated by comparing its prediction of indoor temperature and of energy consumption to the real values. This validation used two distinct steps, the first one consisting of imposing in the model the measured temperature of the corridor and to assess whether temperatures in other zones and gas consumption match with reality. The second step was then to find an appropriate control strategy for the heater so that simulated indoor temperatures agree with their measured counterpart. This validation strategy yielded appropriate results that respect the validation criteria recommended by ASHRAE.
Changing the heating system in the reference dwelling (from the central gas heater to the hot water radiators) leads to a reduction of approximately 5% of gas consumption, mainly due to the better efficiency of the appliances used by the radiator system. In terms of comfort, the change cuts down the frequency of discomfort by 16 to 37%, depending to the city where the dwelling is located. This is explained by the fact that the dwellings with radiators have a more uniform temperature over all the rooms than the ones equipped with a central heater. The use of a central heater leads to high spikes of temperature in the rooms where the heater is located. Because they also heat the walls in addition of the air, radiators also appear to improve comfort by reducing the cold wall effect problem that the reference dwelling is going through. Lack of insulation in the reference dwelling generates a low radiant temperature, which creates a discomfort for occupants in the room. A system that heats both air and surfaces is thus preferable.
Other than the location of the dwelling and its heating system, the impact of improvements of the wall assemblies and of the windows was also analyzed. Introducing air gaps and insulation materials in the envelope, in addition to replacing single-glazed windows by double-glazed ones, decrease greatly the need for heat of the dwelling. However, over insulation is also a problem since it leads to overheating in the dwelling, particularly for buildings located in desert climates. The optimal thickness of insulation that balances comfort and energy use depends on the climates. Thermal rehabilitation still yields a more comfortable environment to occupants, particularly when it is done to poorly insulated buildings. The rehabilitation eliminates the problem of the cold wall effect and thus reduces the heating needs by more than 84% compared to the reference dwelling.
Air exchanges between the different zones of a dwelling is a natural process that is a major part of its energy balance, especially for apartments that have a central heater where heat is propagated everywhere in the dwelling via these exchanges. It would be interesting to assess the performance of such systems when combined with different strategies to increase or control these exchanges. Furthermore, thermal rehabilitation provokes changes in HVAC controls, which was not considered in this paper. Future work could focus on improving the control of the heating system in order to maximize comfort and reduce gas consumption, and on developing a better representation of occupant behaviors in the model (e.g., window opening, use of artificial lighting, etc.).
This work presented a study which concerned a building with a high thermal inertia. The results of this work cannot therefore be applied to buildings with low thermal inertia.
This work should be seen as a first step towards a more formal optimization of Algerian building design and/or refurbishment. Knowing the most important factors affecting Algerian building performance, multiobjective optimization tools could be used with the model in order to minimize a series of relevant objectives such as initial cost, operating costs, greenhouse gas emissions, overheating or thermal discomfort, etc., and then establish comprehensive guidelines for policy makers and building designers. Such future conclusions include the identification of the best refurbishing strategies based on the selected objectives (e.g., cost, GHG emissions, etc.). In particular, as revealed in this paper, there is an opportunity to improve the design and operation of the heating systems in order to reduce gas consumption and overheating in dwellings in future work.
In future work, a comparison should be made between calculated consumptions of buildings and consumptions determined from statistical data.
