

Introduction
Research Objectives
Research Methodology
Scaled-Model Set-up
Data Collection
LSs Configurations
Results and Discussion
First Stage: Validation Method
Second Stage: The Impact of LSs on Daylight Performance
Conclusion
Introduction
Rehabilitation or optimization the quality of interior work-spaces environment through utilizing natural light is one considerable aspect for the sustainable green building construction industry. The primary aim to improve environmental interior daylighting quality is achieving energy efficiency and users’ comfort. Natural light is more efficient at providing more comfortable interior workspace environmental in comparison to use of artificial lighting. Moreover, it also leads to increased productivity and reduced absenteeism among office users. Hence, daylighting has become an essential design strategy for many architects and academic researchers in field of architecture that demands more efficient design solutions on envelopes and apertures. In tropical climate, there is actually abundant quantity of daylight but yet to be utilized, due to the state of the sky which is constantly changing [1].
Due to the changing daylight illuminance level, many building employees in office buildings prefer to close the openings with blinds or curtain and the choice to use artificial lighting during work time which is more controllable. Although measurement showed that outdoor illuminance intensity under tropical sky can reach as high as 140 Klux, the abundance of tropical daylight is ignored by the employees due to the uncontrollable quality [2]. The positive outcomes of natural daylight have been reported as it can reduce absenteeism and enhance workers satisfaction which leads to better performance [3].
Malaysia, just like any other tropical countries has abundance of daylight availability. Despite that, utilizing it is often ignored due to the undesired effects of glare and heat, especially at areas near the windows. Therefore, enhancing daylight levels by minimizing glare and contrast is high priority [4, 5]. However, the conditions of tropical sky does not prevent researchers to create efficacy daylighting architecture solutions on building facades to avoid negative effects of tropical climate such as heat and illumination intensity [6]. The present challenging on daylighting design posed by sky conditions change in tropics such as Malaysia, is daylight system must be designed to work dual; first - providing fully functional shading facade for all sky conditions and second - illuminating system to deliver the incoming natural light into deeper areas of space. This integrated system will decrease energy demand for electric light sources and furthermore, saves energy for cooling purposes [7].
Daylighting systems improve natural light distribution and reduce the excessive glare and minimize using the artificial lighting sources in interior vacuums of buildings. Many daylighting solutions on building facades have been developed in recently [8]. Light Shelves (LSs) are one of the improved daylights guiding system. LSs are generally a device meant to enhance natural light breakthrough into the rear spaces of buildings. It is usually a horizontal or tilted at an angle and maybe fixed or movable attached to upper part of window above the human eye level. LSs work by redirecting solar radiation to inside with ceiling assistance and reverse it to the back of the vacuum [9]. LSs are natural lighting systems, which have been highlighted in various studies as an appropriate approach for enhancing daylighting distribution in rear areas of space [10].
However, daylighting design in side-lighting opening through integrated LSs systems are not a simple strategy, specifically in the tropical climate. New difficulties today in the tropical region with continuously changing sky conditions by using LSs systems is how to make the system works and to provide a fully functional shading facade during all seasons and lighting system that operates appropriately for all sky conditions [6, 7]. The primary aim of this study to present a critical examination under actual sky environment if light shelves configuration could change the daylighting distribution in the rear interiors regarding to illuminance levels and performance in tropics. This research is limited to one orientation south as shown in Figure 1, where diffuse and direct sunlight are considered in order to evaluate how the performance of the light shelf will be changed with modified locations and positions on window in a space located in tropics.
Research Objectives
This research study aims objectively to examine several of light-shelves configuration, that will exploit daylight in a typical Malaysian space unit with south orientation. The study examines whether the light-shelf system is able to achieve:
Enhanced daylight levels at the back of the space unit and to generally improve the daylight distribution for different sky conditions.
Provide shading and minimize the glare in the front part of space near the opening through blocked direct sunlight during the whole period of working hours, considering that shading should not excessively minimize daylight levels, as example if the sky is overcast.
Research Methodology
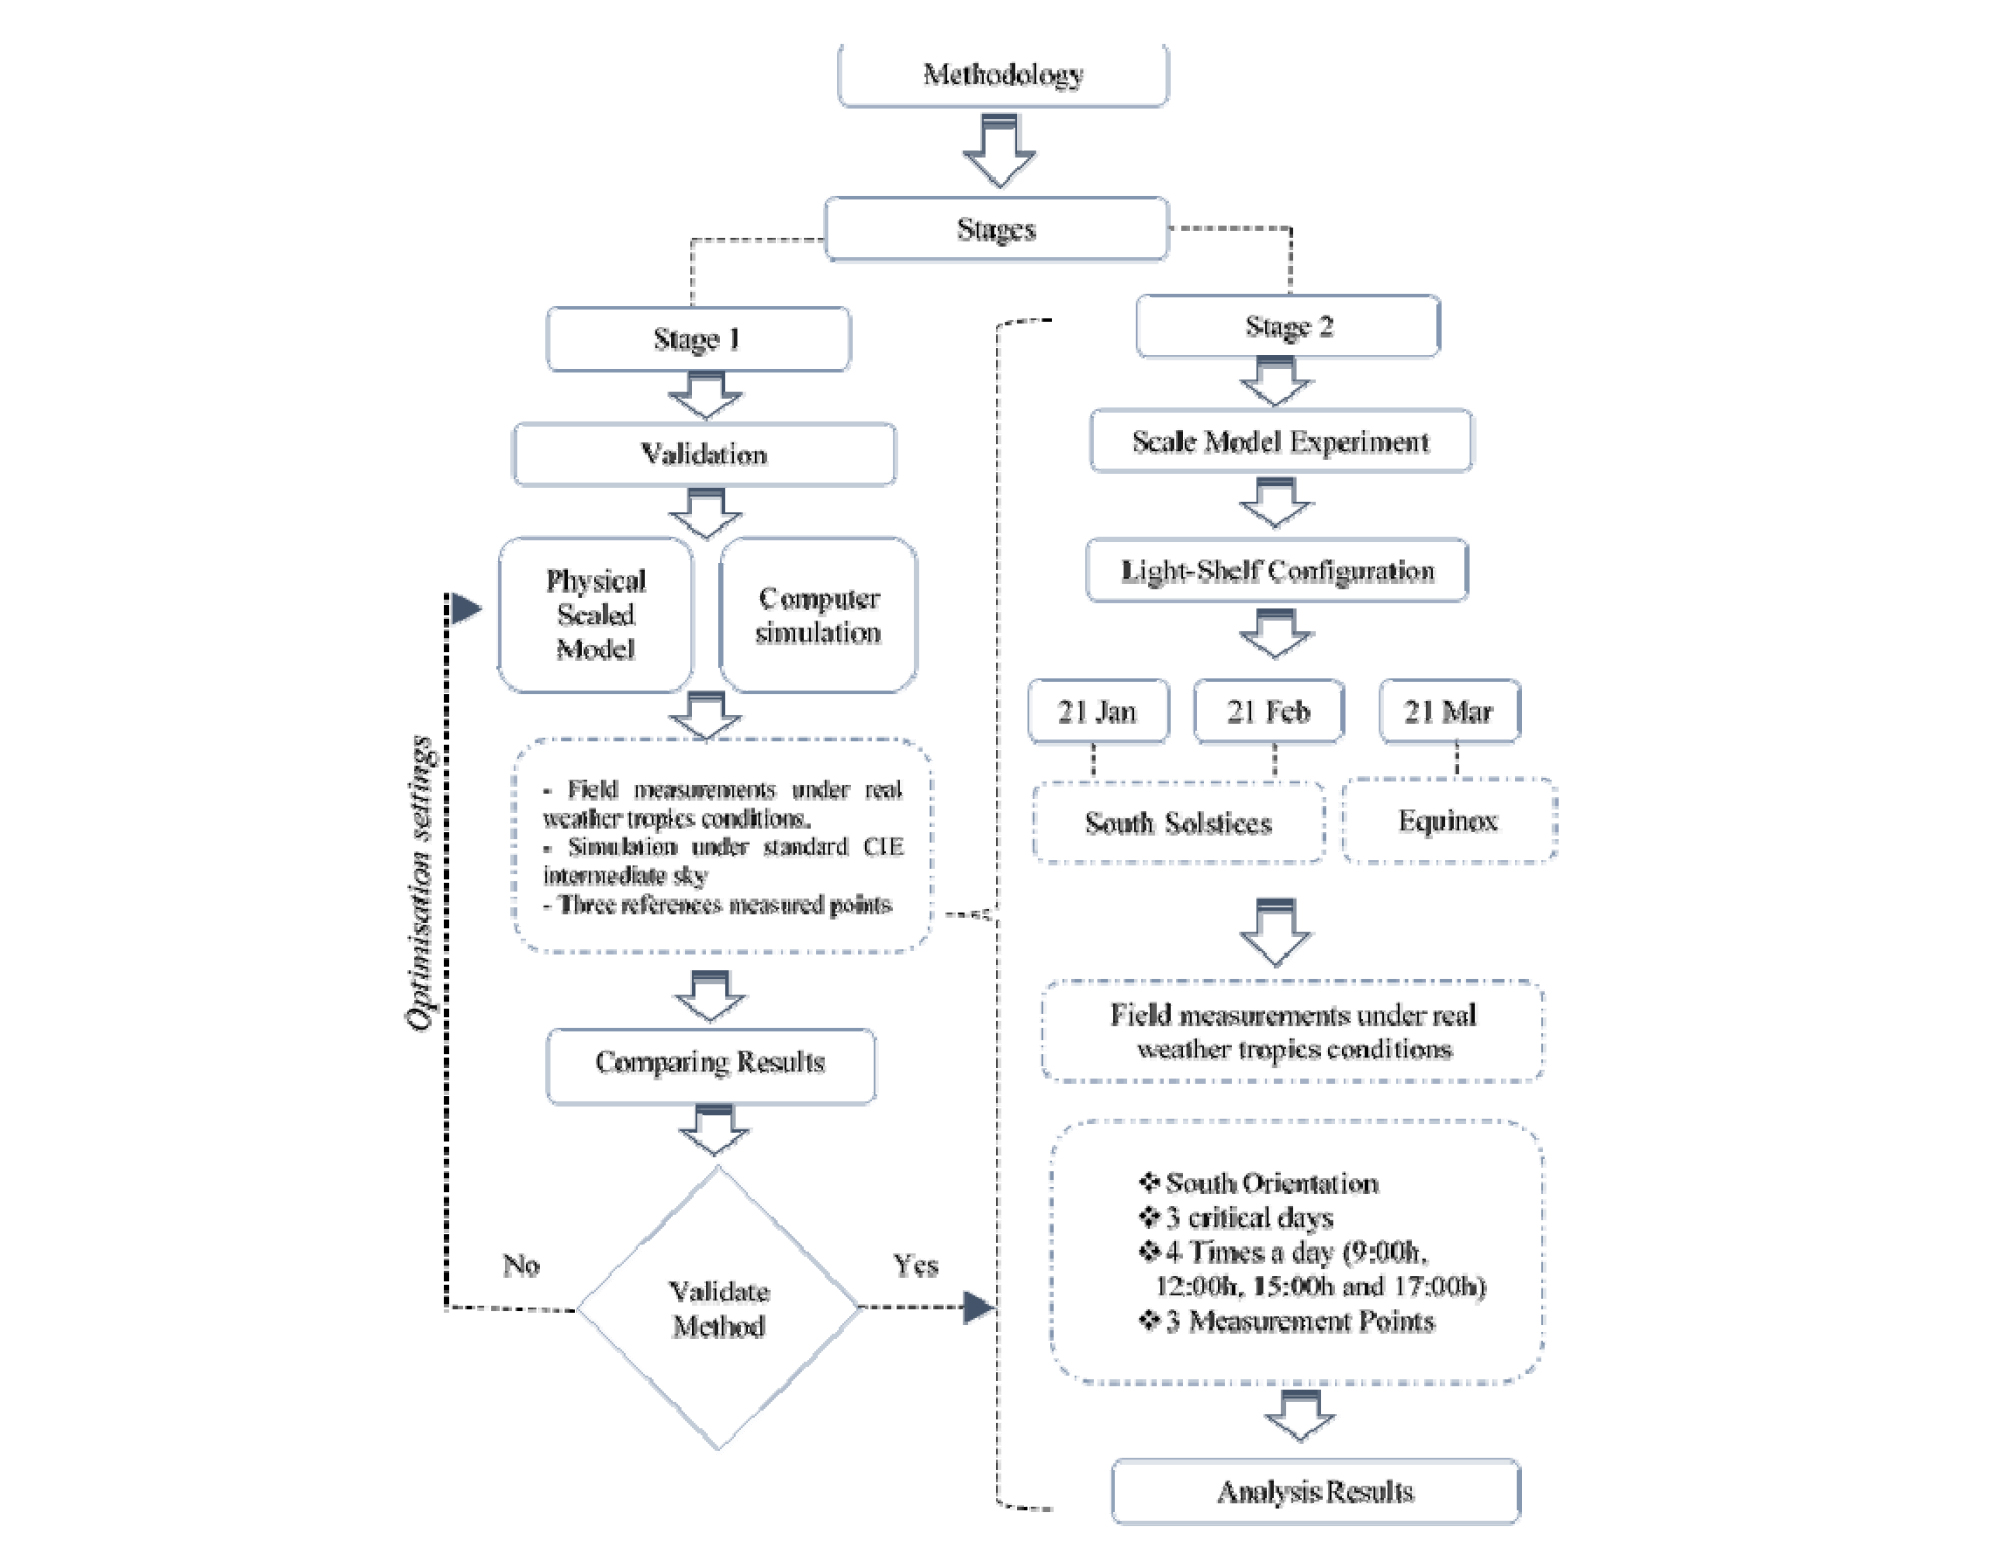
Optimizing and balancing the desirable and unpleasant effects of a daylighting system can be a challenge and requires a comprehensive study under actual conditions environment where the building is built. To achieve the research objectives, the methodology of this study is to directly compare the results of physical tests carried under real sky conditions. In order to achieve successful fieldwork measurements by scale-model method, the methodology as shown in Figure 2. It comprised two major processes; validation and correlation processes as a first stage, in order to generalize the experimental findings. In the second stage different configuration of light-shelves was examined. The experiment of light-shelves was carried out in one qualified scaled model (1:10) of typical unit with single side-lit window facing to the south orientation.
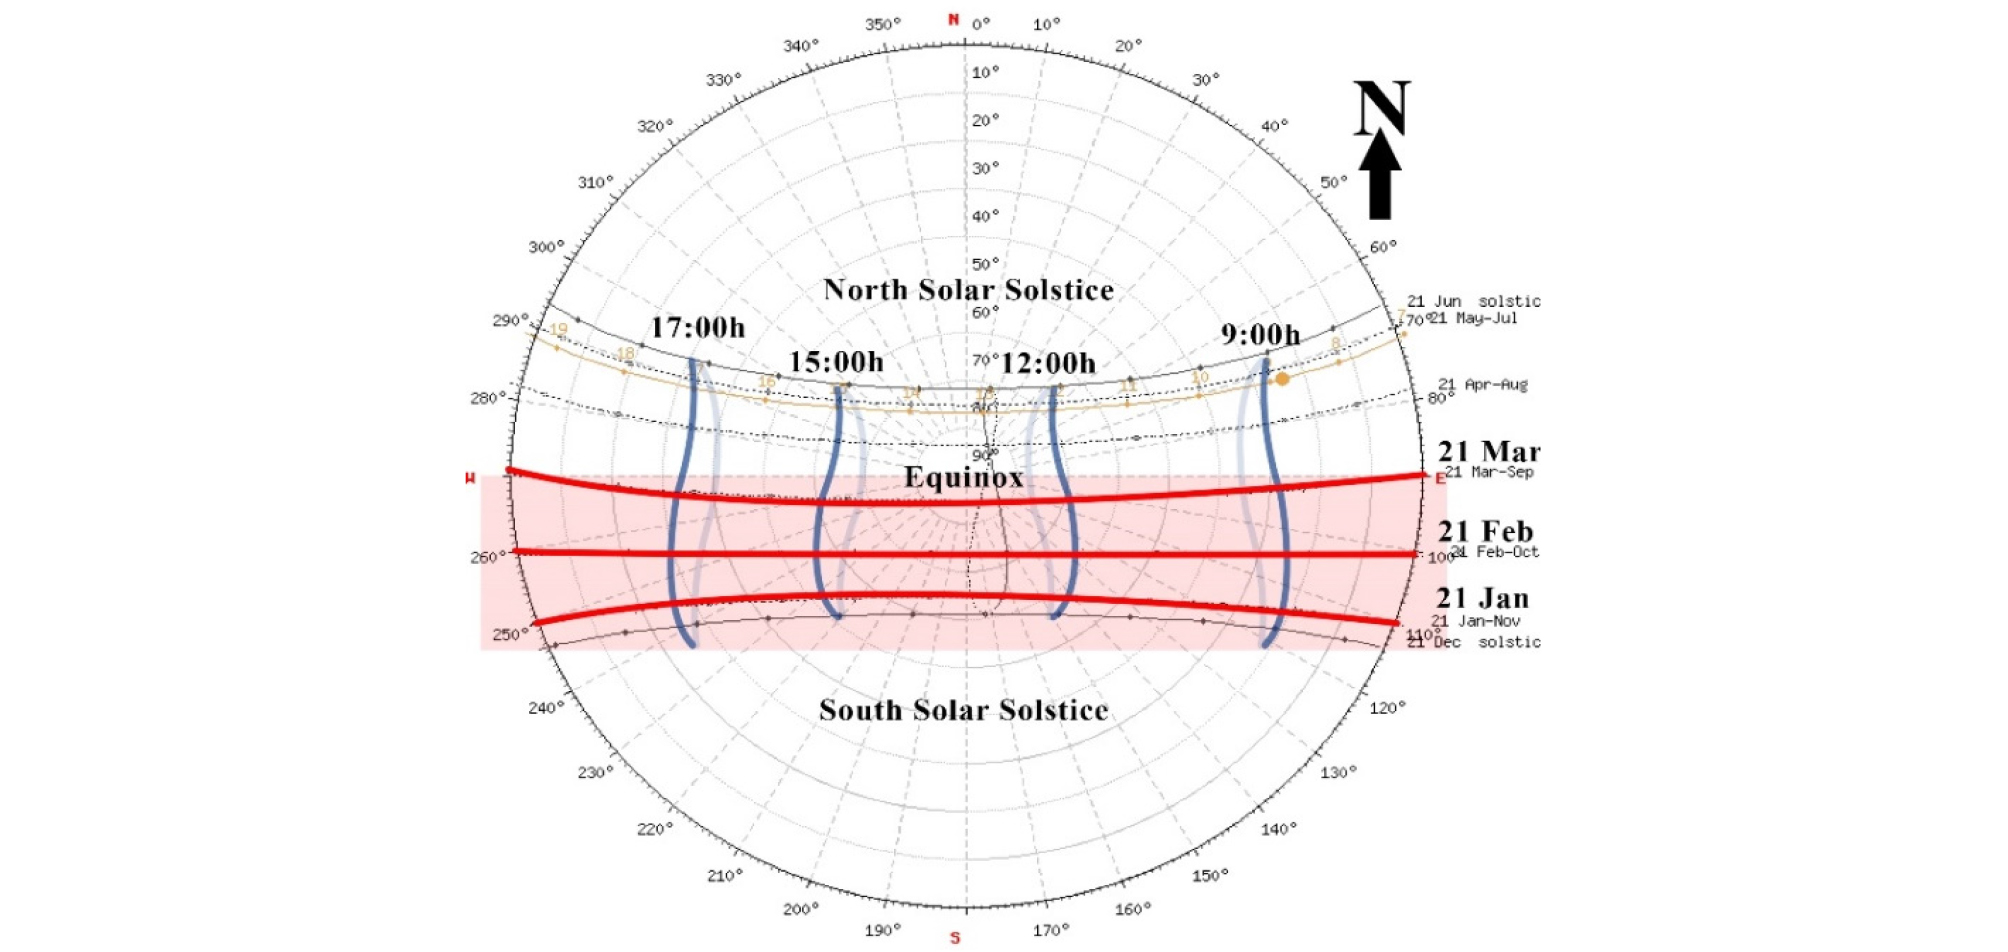
The physical tests took place at in an open area on the top roof of the main building of the School of Housing, Building, and Planning at USM (Universiti Sains Malaysia) in Penang, Malaysia. The experiments have been conducted during 3 months from Jan 2019 to March 2019. On one day of every month (21st Jan, 21st Feb, and 21st March). This selected period was presented by two Solar Solstice of Malaysian Model Year Climate (see Figure 1), where, in the month of Jan and Feb the sun is on the South Solstice while, in the month of March the sun is equinox.
Scaled-Model Set-up
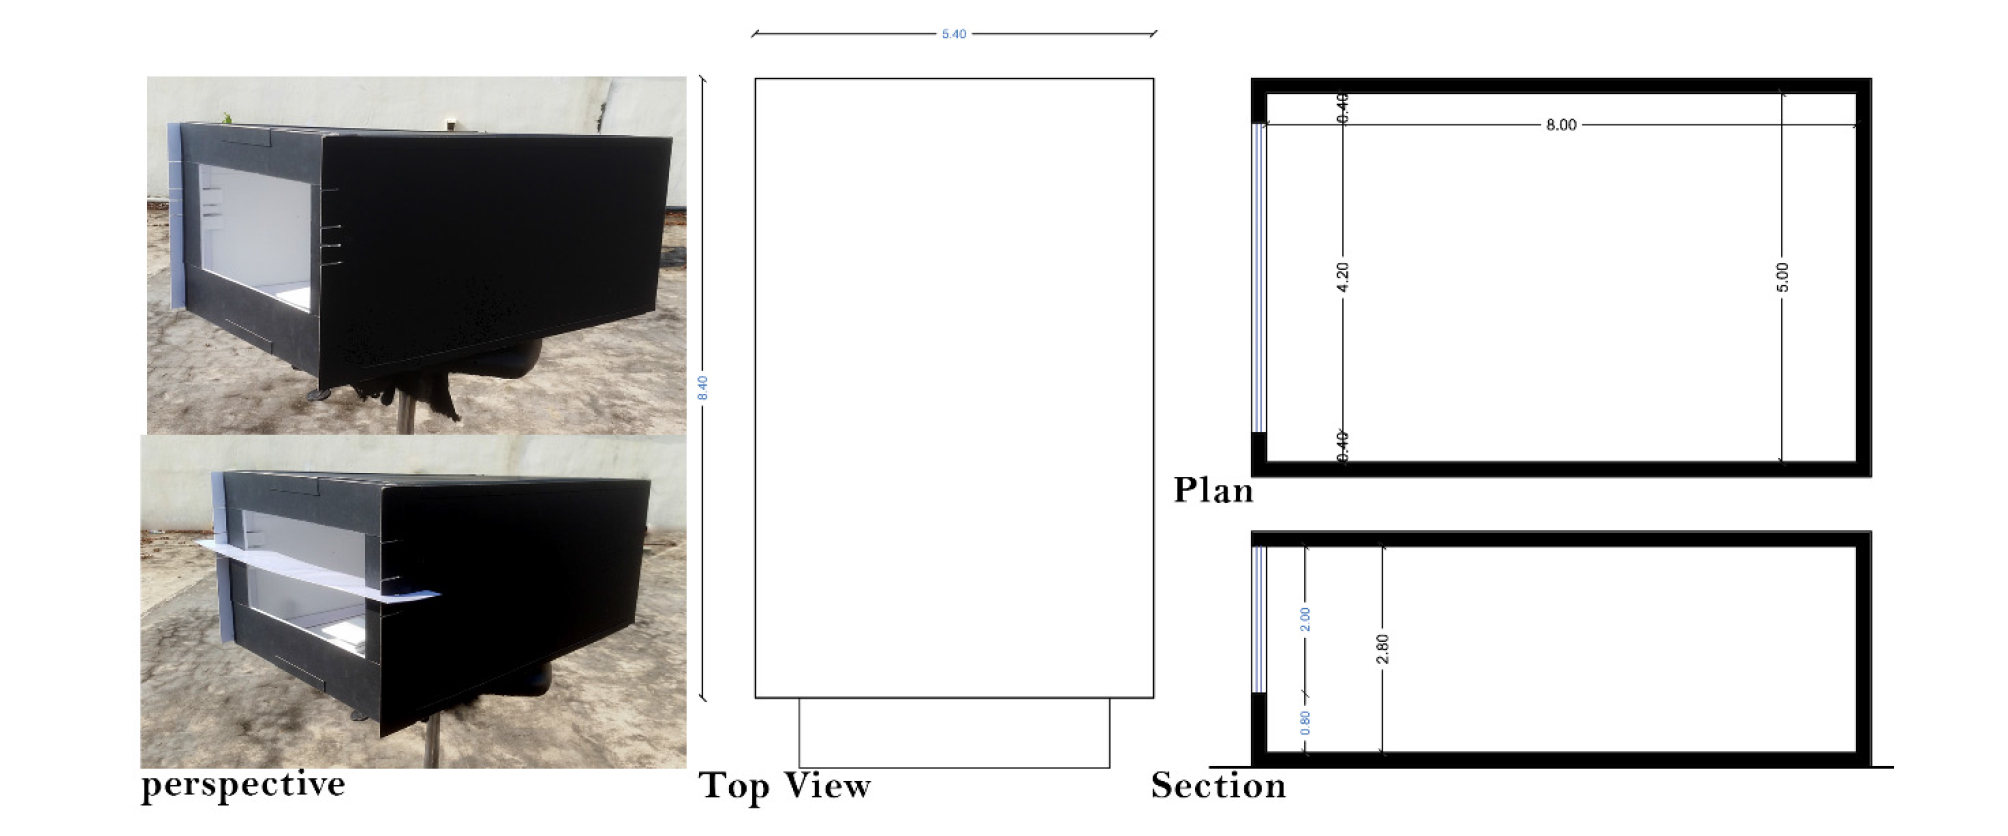
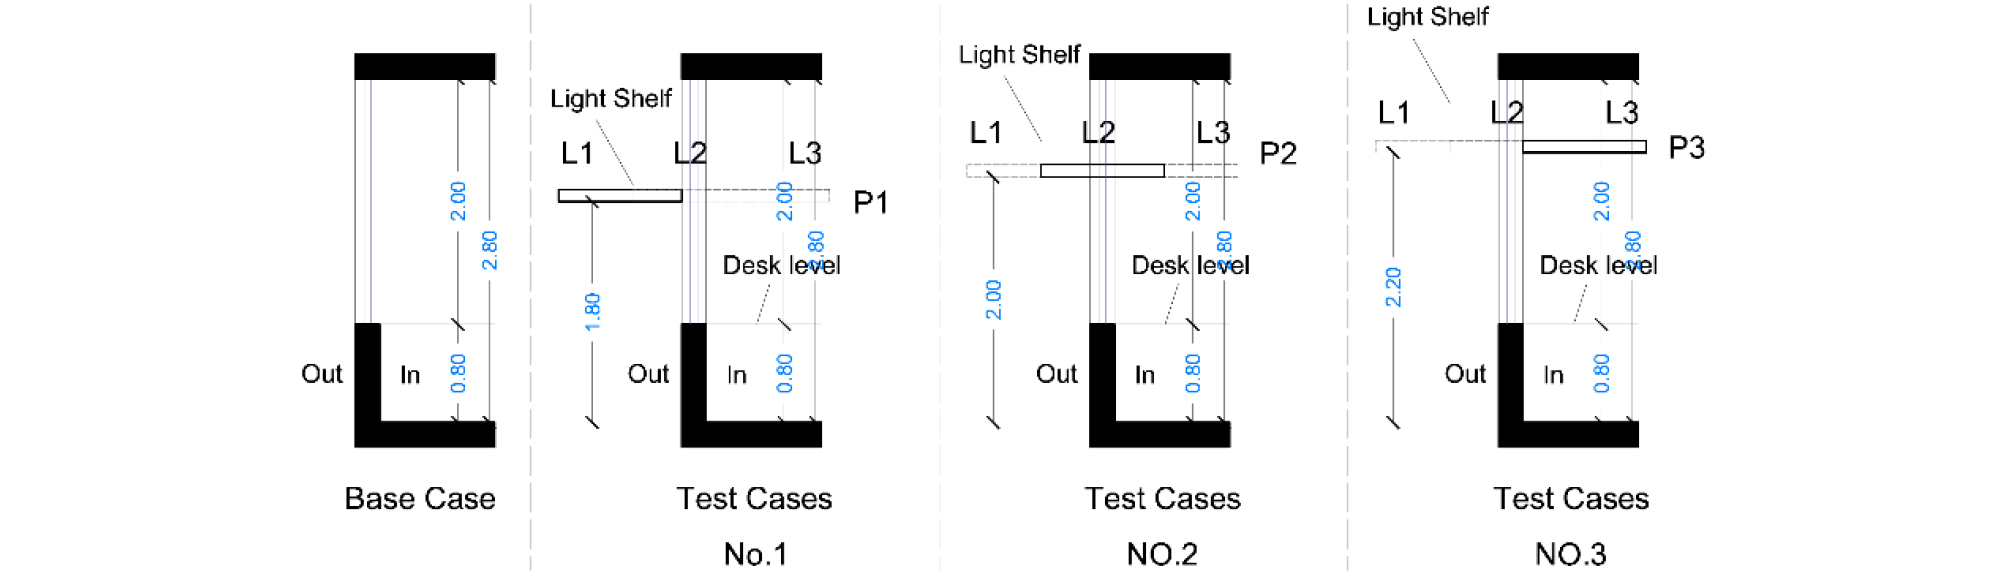
As mentioned in methodology section above, the experiment was carried out in one qualified scaled model (1:10) of typical unit with single side-lighting window. The first time the model service as base case model without any light shelves systems, while the second time, the model works as testing model to explore and evaluate how the light shelves system affect the daylighting distribution as illustrated in Figure 3. The dimensions of the model were 5.00 m width, by 8.00 m depth, by 2.80 m height. Each office unit model had a one sided-lit window with dimensions 4.20 m width by 2.00 m height which resulted in a 40% window-to-wall ratio. The interior walls, floor, and ceiling were painted white, while the external surfaces were painted black to block other sources of daylight entering apart from the single-sided window.
Data Collection
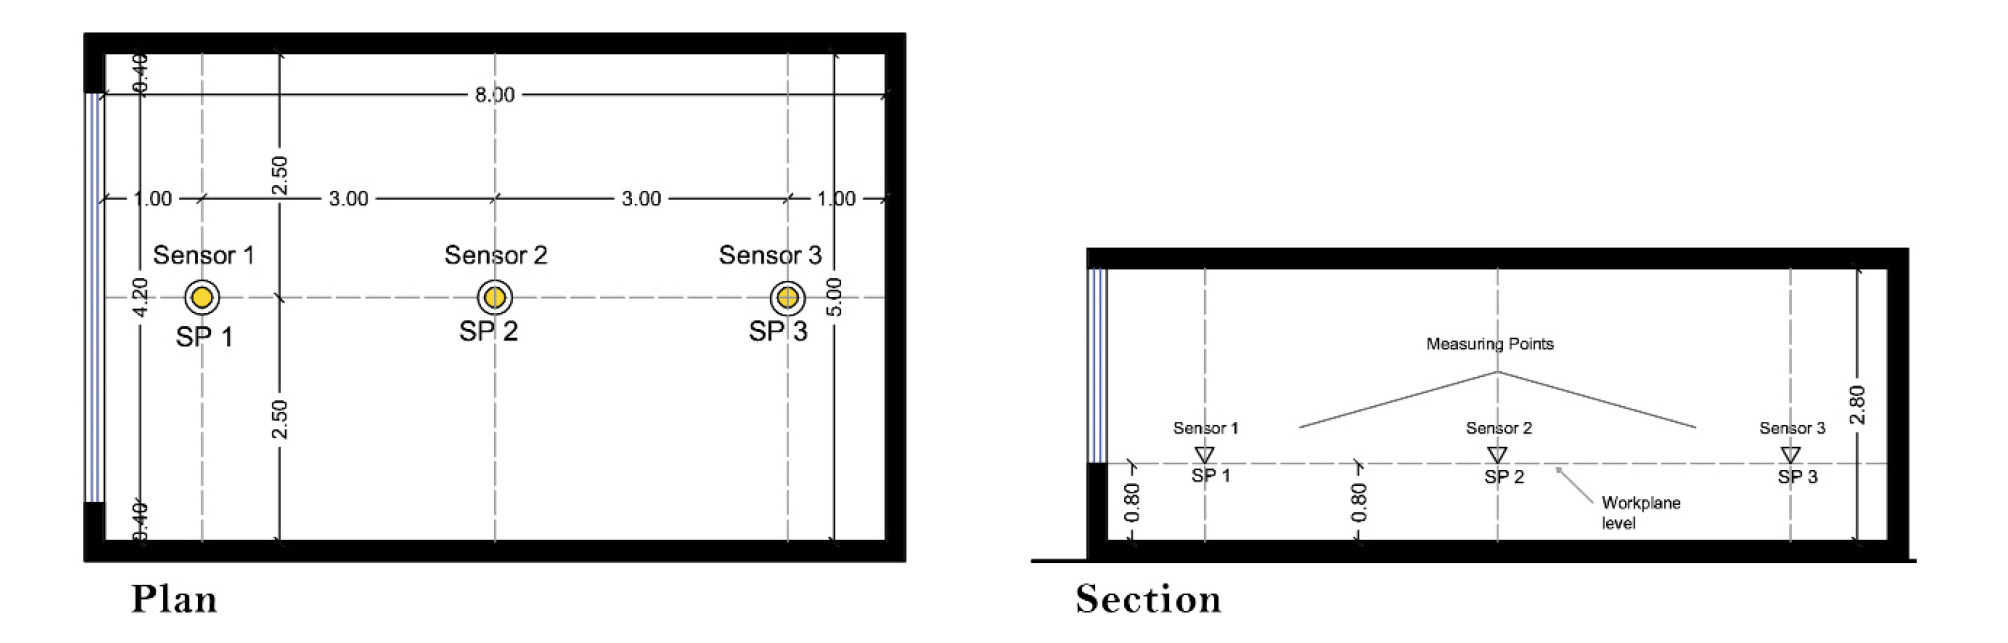
Data collection and analysis was done quantitatively by taking measurements of luminance level inside the space. Three illuminance Sensor Points (SP1, SP2, and SP3) were placed at the middle of the space above the work-plan level at height 0.80m to measure the internal illuminance level in the model with and without light shelf. SP1 and SP3 located at 1m from the window wall and back wall of space respectively, while the SP2 was placed at the middle of the space as shown in Figure 4. The measurements were conducted by using a lux meter (TL-600 Digital Data Logging [accuracy reading ± 4% from 0 to 10.000 lux; ± 10 from 10.000 to 200.000 lux]) as a manual data logger to collect the data in the model.
All tests of light shelves configurations were carried out on three critical days; 21st Jan, 21st Feb, and 21st March 2019 which presented three different solar angles. The analysis was carried out by directly comparing the value of measured sensors points which achieved a given value of illumination for all the test cases, and average illumination were taken to minimize inaccuracies the sensors reading. In order to determine the level of indoor illumination for lighting control, many standards guidelines and studies have provided various ranges of daylight levels, but the optimum level that must achieve is still under debate and testing [11].
The recommended levels of indoor illumination in many countries were reviewed, such as in US between 500-1000 lux, Japan 300-750 lux, and Korea 300-600 lux [10]. Meanwhile, Malaysian standard 1525:2014 recommends a lighting level between 300–500 lux and daylight factor (DF) between 1%-3.5% is acceptable for light and glare, while 3.5%-6% is tolerable for light and uncomfortable for glare. Meanwhile, Green Building Index (GBI) suggested the same lighting level and 1.0% to 3.5% DF for general office [1]. And many researchers recommended that the minimum illumination level of daylight factor of at least 5% [11].
In tropics sky conditions, it is very difficult to calculate Daylight Factor (DF) under real sky conditions, therefore, Daylight Ratio (DR), was instead used as a method to assess the daylight performance under intermediate skies. Daylight Factor (DF) is applied for overcast sky. Previous daylighting publications also used Daylight Ratio (DR) method which is suitable for regions closer to the equator. However, both DR and DF were computed to determine the relative ratio of internal work-plane illuminance level to outdoor illuminance level were calculated by Eq. (1) [12]. This formula was employed in finding actual daylight illuminance in some previous studies [1, 13].
| $$DR/DF = Indoor work plane illuminance /Outdoor Illuminance * 100%$$ | (1) |
As a result, the average range of illuminance level was set in this study between 300-500 lux, and daylight ratio range from 1% - 3.5% as a recommended level of indoor illumination.
LSs Configurations
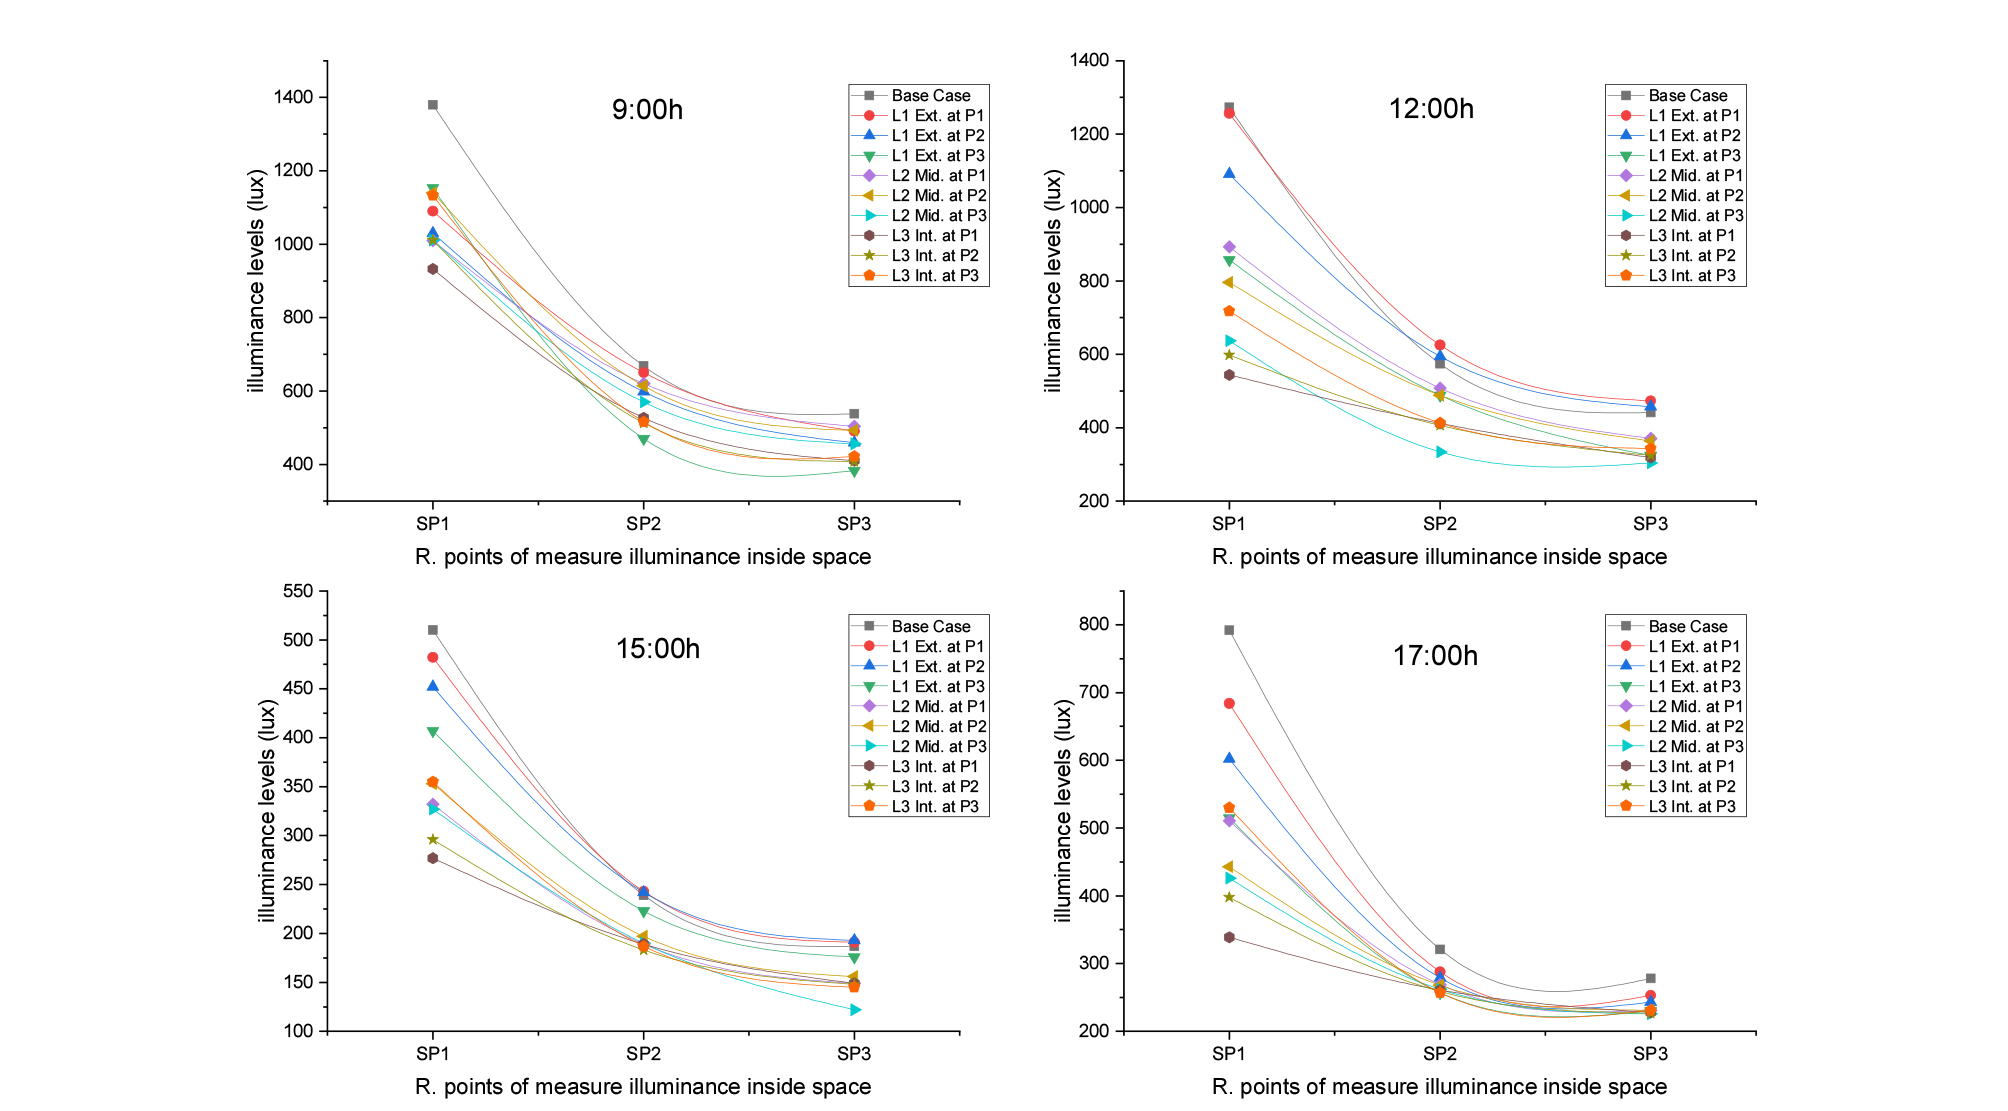
In this study, 3 different location (L) named; (L1, L2, and L3); external, middle, and internal respectively, and three height positions (P); (P1, P2, and P3) at 1.80 m, 2.00 m, and 2.20 m respectively of light shelf configurations were experiment as shown in Figure 5, were examined in south orientation with single side window at four different times in a day; 9:00 am, 12:00 noon, 15:00 pm and 17:00 pm. using scaled model experiment. The width of the all LSs configurations were set at 1 meter based on previous studies.
Results and Discussion
First Stage: Validation Method
In the architectural research committee field, usually the scaled-models tendency to overestimate the observed daylighting performance of real buildings as some references pointed out [2, 14]. Thus, validation is an important step to take. Previous studies [15, 16, 17] suggest that validation using relative metric such as DF and DR are more reliable than absolute metric (such as the illuminance itself). Discrepancies are however cannot be avoided completely. some studies have indicated by authors that the average level percentage of Daylight Factor (DF%)/Daylight Ratio (DR%) between results of fieldwork studies and computer simulation tools must be with the range less or equal 10% [18, 19].
In this study, Validation was made by comparing the DR% values obtained from simulation used Radiance-based computer simulation, with the DR values obtained from the scaled-model measurement on site. Because, in tropics sky conditions, it is very difficult to calculate Daylight Factor (DF) under real sky conditions [12]. Many studies demonstrated that the use of DR calculation method which is more suitable for tropics regions using equation (1) [12, 16, 20][12, 1620].
The internal illuminance of physical scaled-model and simulation model was measured and compared in points SP1, SP2 and SP3. The locations of the measurement points were exactly at the center of space at work plane height 0.80 m (see Figure 4). The dates and times selected for validation analyses were 21st Jan, 21st March, at the same experiment time (9:00 h, 12:00 h, 15:00 h and 17:00 h) with South orientation, these times indicate to the different solar angles of sun path throughout the day. as well as, these arrangements represented the intermediate sky with and without direct sunlight.
In summary, the percentage of difference between the performance indicators DR in the base scale model and simulation models were compared as shown in. Pearson correlation analysis was employed to exam the relationship of DR% between prediction results from the physical scaled-model and simulation model as shown in Table 1. The comparisons clearly showed that, all selected regression models were acceptable at the significance level between 0.01-0.04.
Table 1. Statistical analysis of Pearson correlation analysis of base scale-model and base simulation model DR
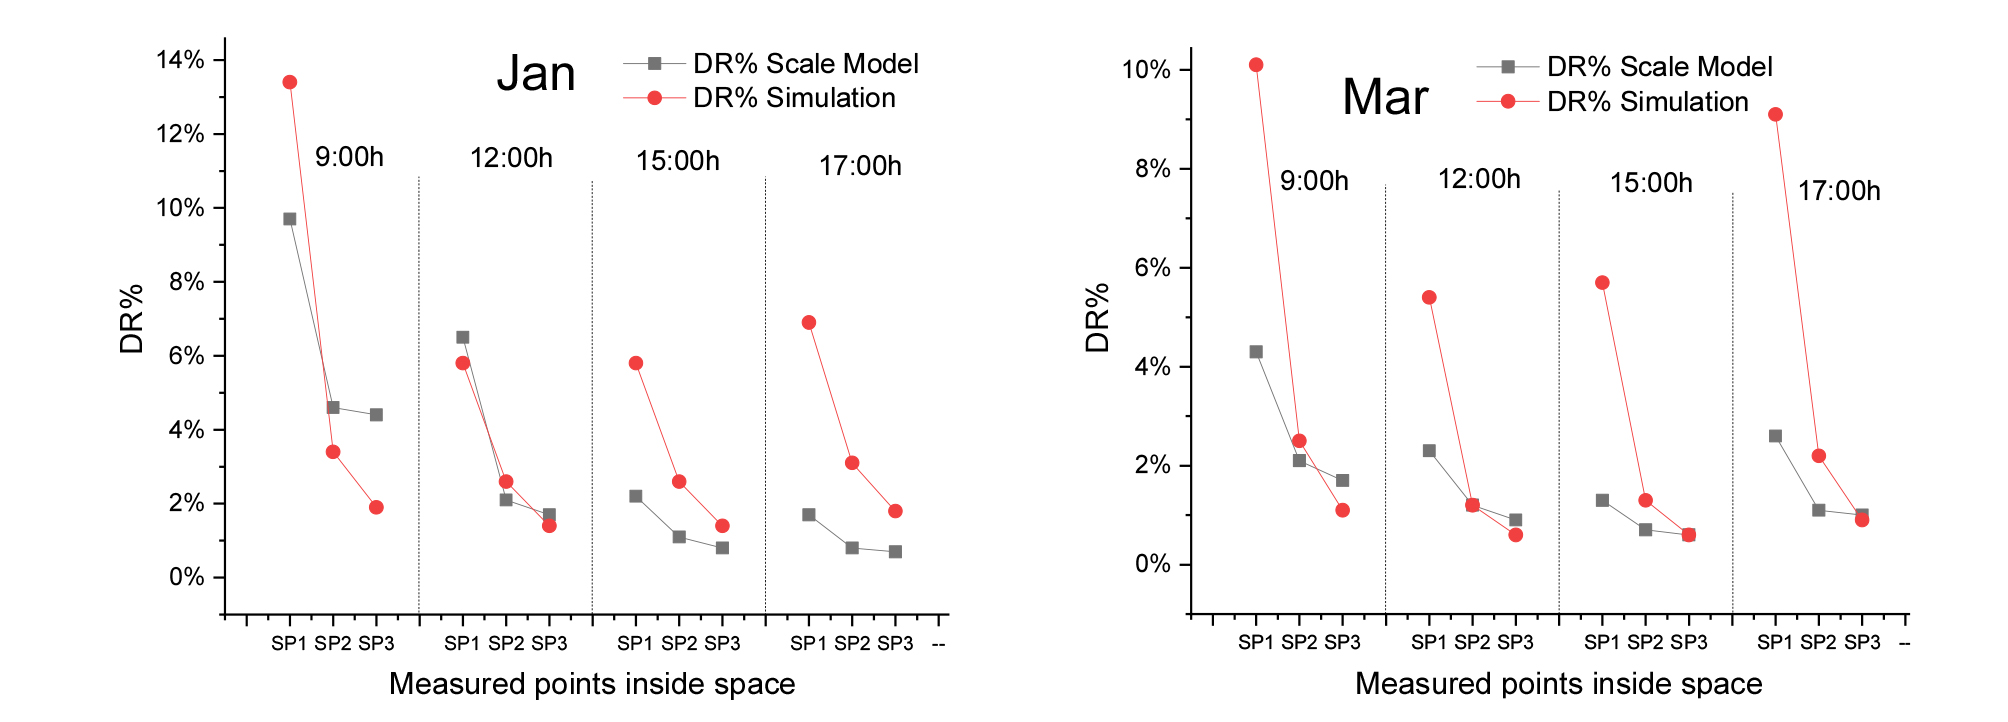
A comparison was made by calculating the percentage of difference for various times in a day for south orientation and the results are presented in Figure 6. Overall, the results showed the average DR% differences between simulation and scaled-model measurements are 1.2% and 1.8% (≤10%) on Jan and March respectively, which is an acceptable result, indicating the validity of the scaled model in terms of accuracy. In other words, the criteria used were reliable and acceptable for predicting internal illuminance. Therefore, the model is deemed valid and fit for further daylighting measurements.
Second Stage: The Impact of LSs on Daylight Performance
The performance of the varied light shelves configurations (locations and positions) were evaluated through the room at three defined sp1, sp2 and sp3 points with the criteria of daylight distribution, and comparisons with the south facing window were carried out. To examine the daylight performance of the LSs system direct comparison of the value of calculated by sensors points and the results were compared to a base case.
Figure 7 to Figure 9 show that the illuminance levels achieved by the light shelves for south orientation during tested days, and it illustrates the comparison of daylight distribution at 9:00 h, 12:00 h, 15:00 h and 17:00 h. for base case and all testing cases of light shelves, on the working surface, and how the varied light shelves locations and positions configurations could change the daylighting distribution. Generally, from the figures, 21st of Jan has recorded the highest value of illuminance levels in all measuring points as the sun is at the South Solstice, while the lowest of illuminance level was on 21st of March when the Sun is approaching to the top of the head (equinox). And also, it was seen that the illuminance intensity without light shelf (base case) near the window at (SP1) in all testing days of three months is much higher than illuminance intensity with light-shelves.
On the month of Jan, Feb and Mar when the sun is at low altitude at 9:00 h with external illuminance was as high as 31.1klux, 26.4 klux and 32.4 klux respectively. As shown in Figure 7 and 8, for each of the nine light-shelves types comparing to the Base Case model, when the Sun is at the South Solstice (Jan and Feb), it can considered that the optimal case of light shelf is at location L2 and position P1, where it gives the best results in reducing the illuminance level in the front (SP1) and increased it at the back of room (SP2 and SP3).
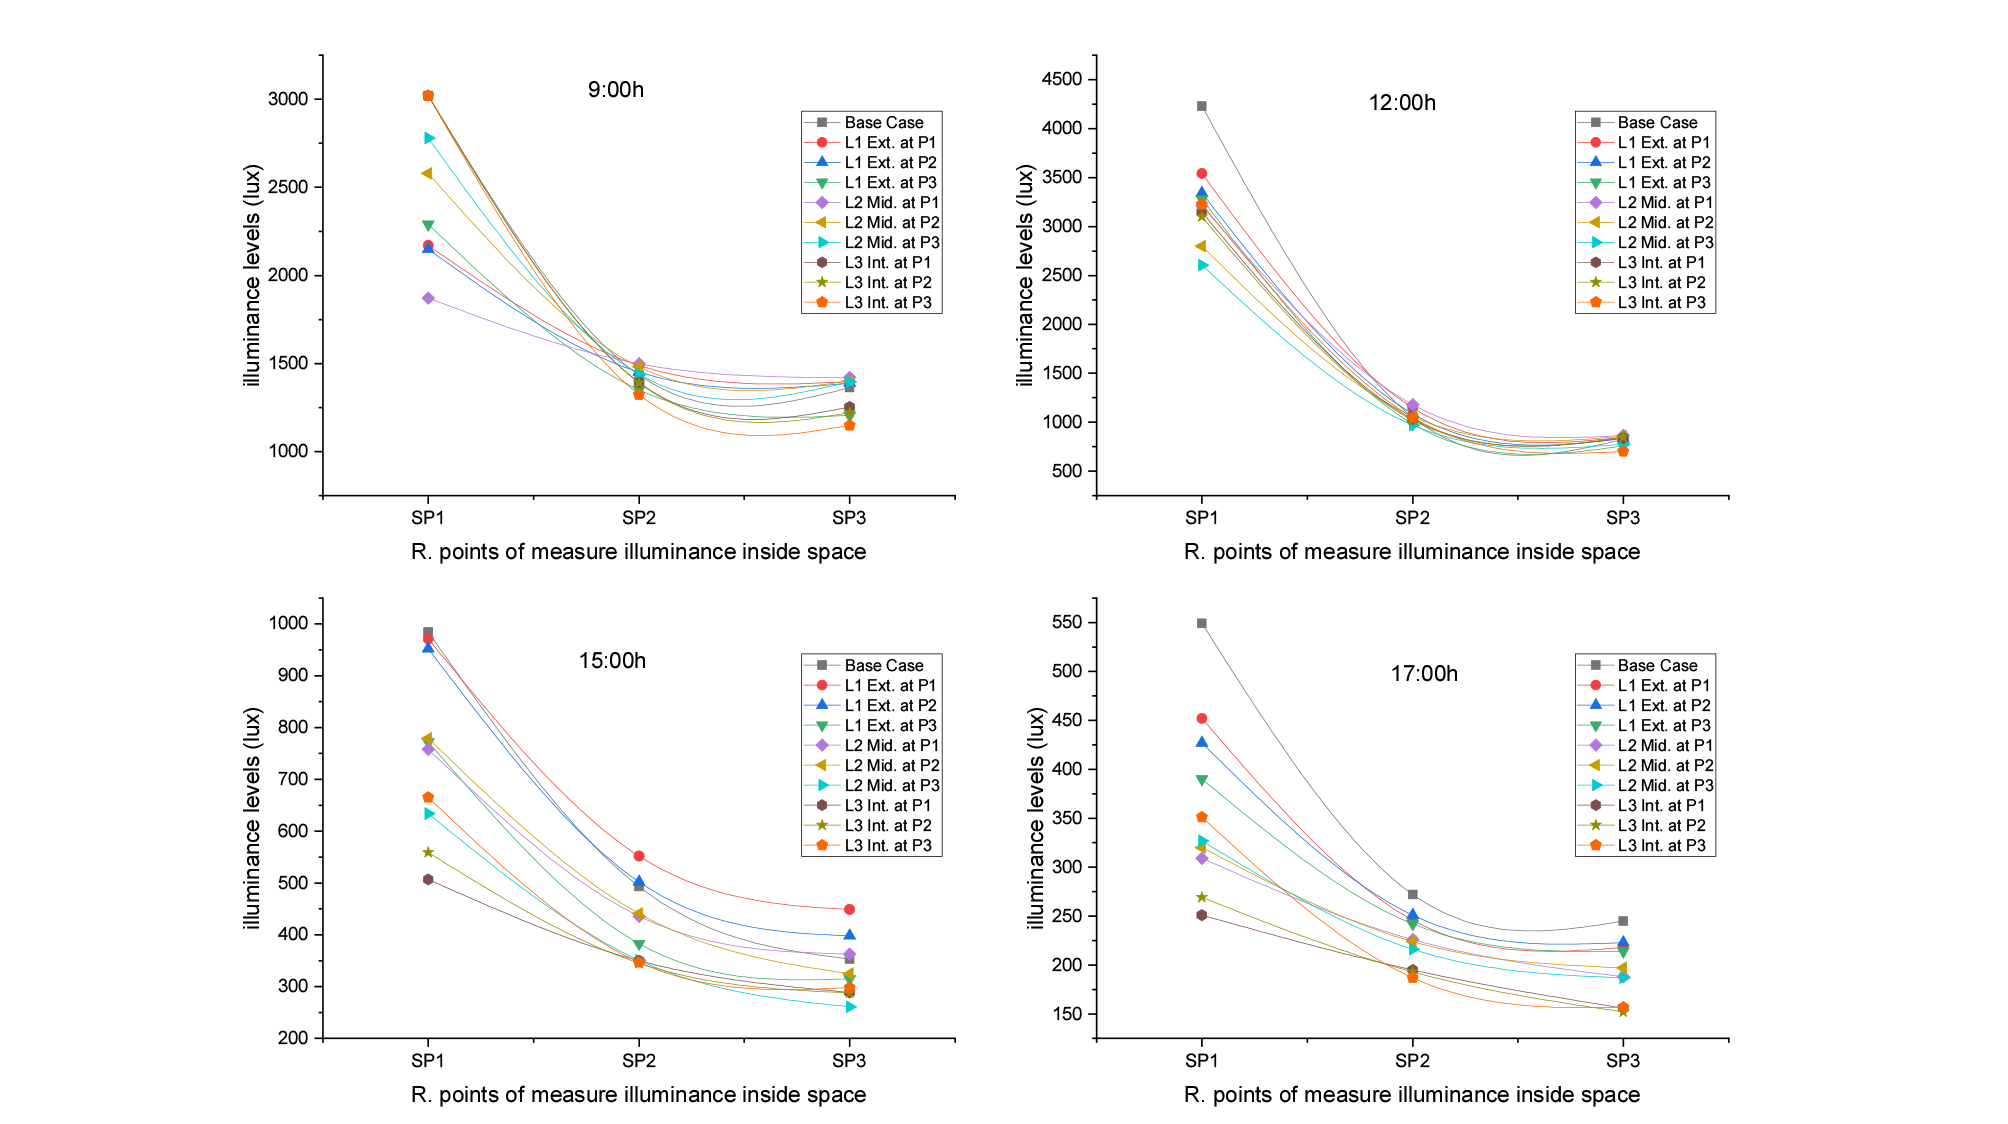
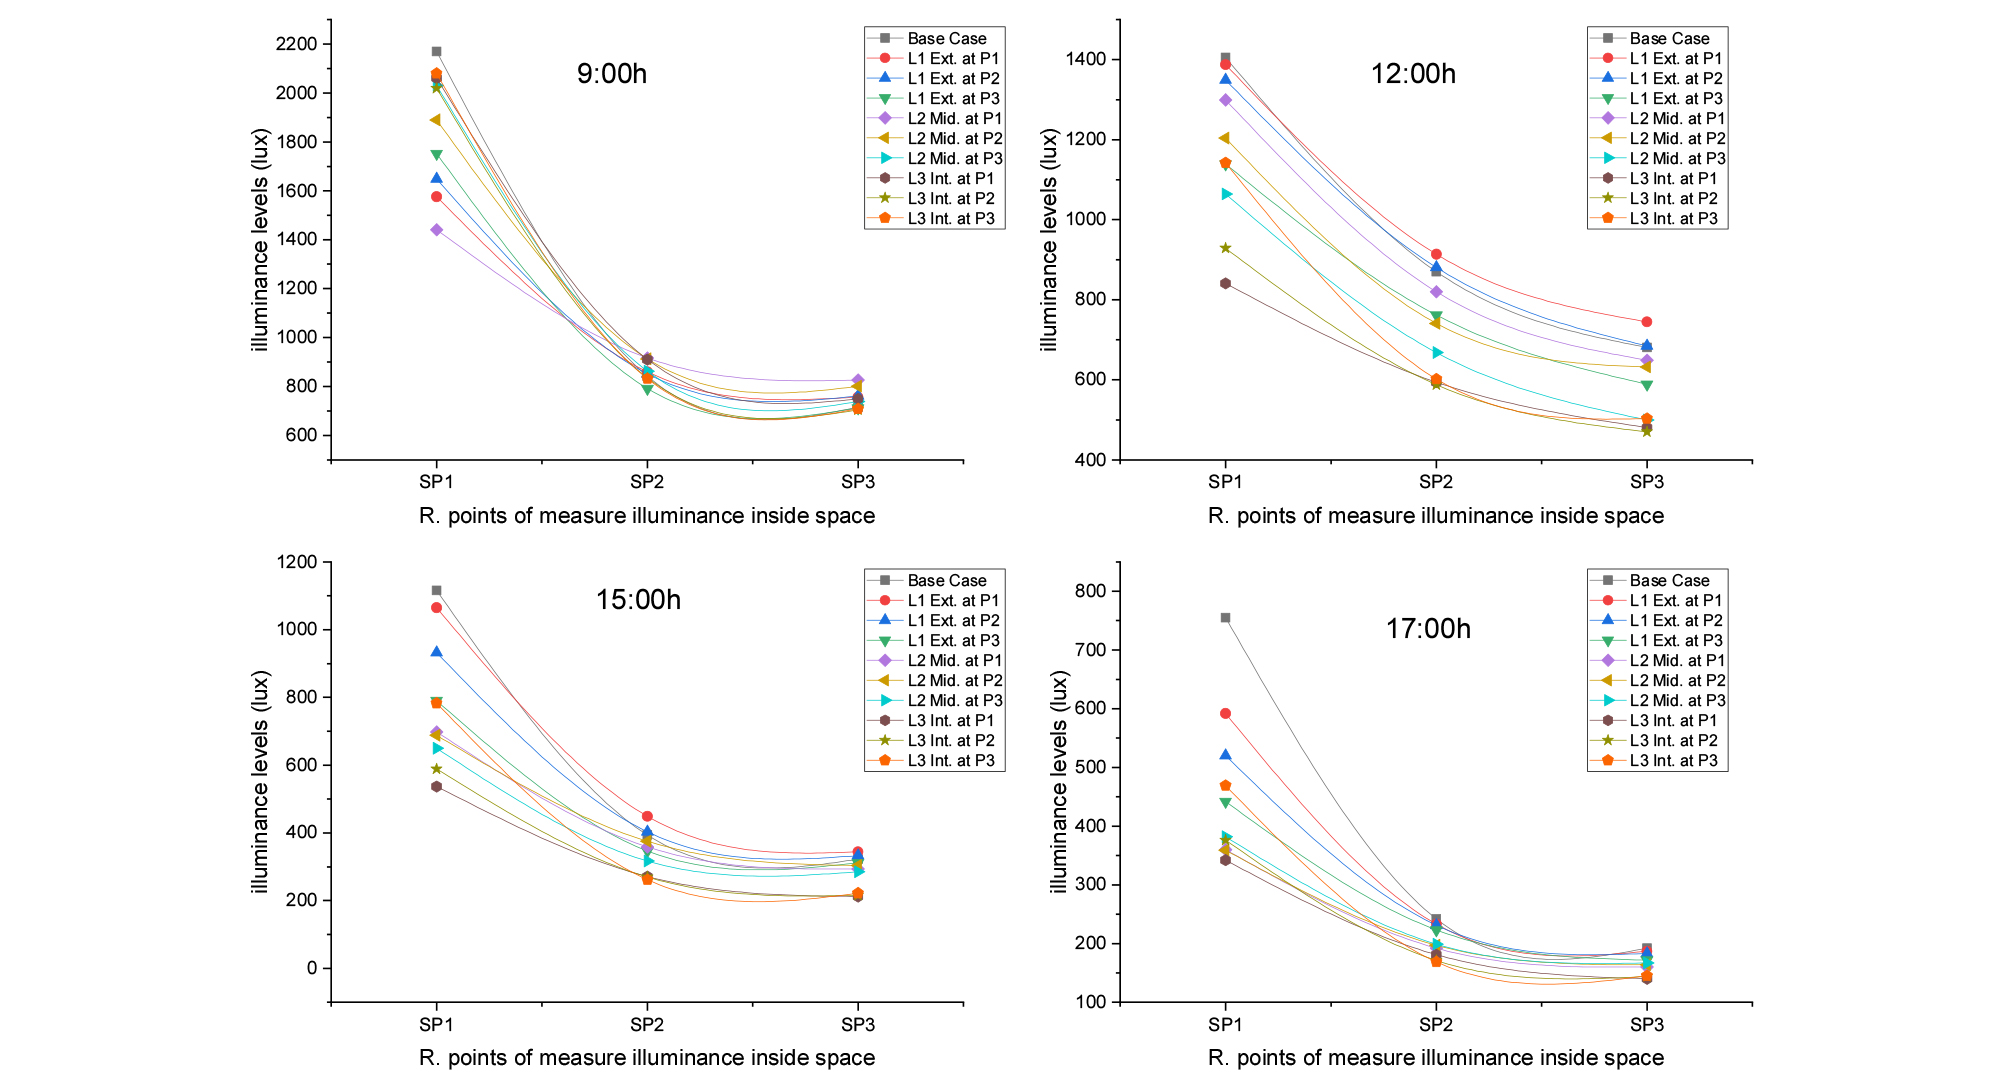
From the results achieved it can considered the optimal case of light shelf is at location L2 and position P1, where it gives the best results in reducing the illuminance level in the front (SP1) by 38.1% and increased it at the back of room (SP2 and SP3) by 4.5% and 4.2% respectively, but the illuminance level still is not within the recommended level on Jan. While on Feb, it decreased the illuminance levels by 33.6% near aperture and improved the illuminance at the middle and back of the space by 9.0% and 15.5% respectively. On the month of March, when the Sun is at the middle solstice with outdoor illuminance was as high as 32.4 klux. the light shelves not performed well, because the illuminance levels measured with light shelf system was less than those gotten from the Base Case, and all light shelves were slightly decreasing the illuminance levels at the middle and the back of space (see Figure 9).
The most critical illuminance levels condition when the sunshine directly more concentrating on south facing facade was observed between 12:00 h to 15:00 h. On this period of time when the sun altitude was above the head and perpendicular to the building with external illuminance was as high as 49.9 klux, 47.8 klux and 51.2 klux at 12:00 h on Jan, Feb and Mar respectively. At 15:00 h when the sun began to tilt toward the west with external illuminance was as high as 43.8 klux, 51.2 klux and 44.6 klux at 15:00 h for Jan, Feb and Mar respectively. On this period of time comparing to the Base Case without light-shelf, the best configuration of light shelf system on the month of Jan, Feb and Mar were light-shelf at location L1 and L2 at positions P1 and P2, managed to improvise the middle of space (SP2) and the back (SP3) daylight levels by just a little. from the figures, it can considered that the light shelf at location L2 and height position P1 is the optimal design in Jan and L1 at P1 on Feb to enhance the daylight in the middle and the back of space, While on Mar L2 at P1 performed well.
At 12:00 h It was noted that the illuminance levels decreased by 24.1% and by 4.0% near aperture, while enhancing the illuminance by increased illuminance levels by 12.3% and 4.7% and by 1.3% and 0.6% at the middle and back of the space in Jan and Feb respectively. While on the month of Mar, it decreased illuminance levels by 14.3% and near aperture, and increased by 3.5% and by 3.6% at the middle and back. While at 15:00 h. the illuminance levels decreased 1.3%, 4.8% and 5.5% on Jan, Feb and Mar respectively near aperture, while enhancing the illuminance by increased illuminance levels by 12% and by 27.2% at the middle and back of the space respectively on Jan. On Feb increased illuminance levels by 14.0% and by 6.8% respectively. On Mar increased illuminance levels by 1.7% and 2.1% respectively. At the period time from17:00 h when the sun at west. all light-shelves configuration not performed well, because the illuminance levels measured with light shelf system was less than those gotten from the Base Case in all months, and all light shelves were decreasing the illuminance levels at the middle and the back of space.
From the analysis above, can summarized that the light shelf is performed well to improve the daylight in south facing opening, with direct sunlight when the sun at south solstice (Jan and Feb). In this case the light shelf works dual; 1) as shading device to block the direct sunshine to enter to the space and 2) as guiding system to reflect the direct solar radiation light to rear areas. while most of light shelf configurations it cannot deliver the diffused light into inside space when the sun at Mar. as well as the area on the back of space is completely out of the recommended range of daylight and it needs support from artificial lighting to keep interior space within recommended range of daylighting. Tables 2, 3 and 4 presented the daylight ratio were giving by with and without light shelves systems.
Table 2. Daylight Ratio (DR) in all measured points with and without LSs on Jan
Table 3. Daylight Ratio (DR) in all measured points with and without LSs on Feb
Table 4. Daylight Ratio (DR) in all measured points with and without LSs on Mar
Conclusion
The present study aims to investigate the influence of a light shelf on daylight performance in south facing opening at four fixed times and it has achieved significant results in this respect. Unfortunately, the potential of light shelf is barely used for design daylight in buildings in Malaysia. The experimental results analysis illustrated that there is a potential of light shelves system to changed lighting levels in the rear interior spaces. This study is proved that sunlight or diffuse light can be redirected to achieve adequate daylighting within spaces in most cases, but in a somewhat meager but acceptable manner. The results from this study reveal that the light shelf per-formed quite good for south orientation.
This study can be the basis to develop light shelves systems for it used in tropical buildings. Finally, the outcomes of this research will be useful to architects and building designer in the tropics who need to integrate daylighting into the buildings as a main source of light to achieved energy efficiency and the sustainable. Further investigations will be carried out in the other orientations like East, West and North.
