

Introduction
Materials
Methodology
Analysis of Results
Analysis of workability test results
Analysis of compressive strength test results
Analysis of Split tensile strength test results
Analysis of Flexural strength test results
Ductility and crack resistance
Empirical relationship between properties of quaternary and FRC
Conclusion
Introduction
Concrete is made by mixing cement, fine aggregate, coarse aggregate, water and other additives in required proportions and is also the most widely used construction material because of its versatility. Concrete production contributes around 5% of annual global carbon di-oxide produced due to human activities and cement which is the binding material in concrete has the maximum share. The CO2 emissions were 1.45 ± 0.20 Gt in the year 2016, which is equivalent to about 4% of fossil fuel emission. The gross total discharge from 1928 to 2016 were 39.3 ± 2.4 Gt, out of which, 66% have occurred since 1990 [1]. India & China are among the largest manufacturers of cement with India consuming about 270 million metric tons in 2017. Thus the use of supplementary cementitious materials is a sustainable step towards reducing the overall carbon footprint and also the ECO2 is higher for cement as compared to the SCM’s [2]. But, sustainability is not the only criteria for replacement; the strength and durability requirements of the concrete according to its application also have to be met. So keeping this in mind the levels of replacement will vary. These materials modify the chemical and physical properties of the concrete by reducing permeability due to the pozzolanic reaction between portlandite and amorphous silica in SCM’s which depends on its amount and solubility. The use of pozzolanic materials, such as, flyash, ggbs, micro silica etc enhances the resistance to chloride attack, sulphate attack because the hydration product, calcium hydroxide gets mostly consumed, which is the most susceptible to acid attacks and also the concrete become more impermeable [3-5]. Moreover, the rate of strength development of concrete partially replaced by SCM’s increases with the age of curing and the ultimate strength of the concrete is significantly higher as compared to the control mix [6-9]. Attempts are made by various researchers to study the chemical and physical properties of concrete by replacing the cement by two or more pozzolanic materials and the results obtained were promising. Partially replacing cement by a pozzolanic material is called a binary blended concrete, by two pozzolanic materials is called a ternary blended concrete and by three pozzolanic materials is called a quaternary blended concrete. The rate of strength development is such mixes are slow initially; they have comparatively less early strength but with time the strength develops and such mixes show significantly high strength after 56 days of curing [10-13]. The increase in strength both compressive and tensile is observed up to limiting the level of replacement. For binary concrete replaced with GGBS, that limiting amount is around 40-50% cement replacement [14], similar is the case for ternary and quaternary concrete mixes. Moreover with the increase in cement replacement after a certain limit, the workability also decreases thereby creating compaction problems. In this present study, the cement is replaced by flyash, micro silica (SF) and meta-kaolin (MK) in varying proportions with maximum cement replacement being 50% by mass along with 1% steel fiber by volume as the studies have indicated that it is the minimum amount of steel fiber required for notable improvement in flexural response of concrete [15-16]. The focus of the study is to investigate how the physical properties of a quaternary blended concrete such as flexural strength, post cracking ductility, cracking resistance etc. be enhanced by the steel fiber. The scope was further increased to the comparative study of the strength results obtained with the empirical equations from past researches.
Materials
OPC- 43 Grade cement (IS: 8112-1989), crushed gravel as coarse aggregate (nominal size 20 mm), river sand as fine aggregate conforming to IS: 456-2000 was among the usual concrete material used in the study. The supplementary cementitious materials such as flyash(Class F), micro silica (Silica Fume) and metakaolin were used and their properties were found out as per the relevant standards. M35 grade of concrete was selected for examination and the mix was made with constant water to cementitious material ratio of 0.42 and 1.2% dosage of super plasticizer. Novocon XR (ASTM A820/A820 M-4) type steel fiber was used with a fixed dosage of 1% (Aspect Ratio = 50) by volume. The purpose of incorporating steel fibers was to enhance the post cracking strength, crack resistance and to improve the early strength of quaternary concrete. Table 1(a). and 1(b). lists down the material properties used in present research.
Table 1(a). Physical property of Novocon XR fibres
| Type | Specofic Gravity | Tensile Strength (Mpa) | Aspect Ratio |
| Novocon -XR (l/d =25) | 7.86 | 1042 | 50 |
Table 1(b). The Physical property of material added in concrete mix.
Table 2 highlights the various quaternary mixes studied and the also shows the percentage replacement of each material in those mixes. A cement was replaced by the SCM’s chosen in two sets, in the first set the cement replacement is 30% and in the second set the replacement is 50%. To study the effect of fiber incorporation in the quaternary concrete separate specimens with a fixed quantity of fiber i.e. 1% by volume was also casted.
Table 2. Quaternary Concrete Mix Proportions
Methodology
The total number of concrete samples tested in the study was 135. Each bath comprises of 45 cubes of standard size 150 mm (L x B x H) for the compressive test under static loading conditions. For the split tensile test 45 cylin drical samples of dimensions 150 mm diameter: 300 mm height and 45 beams for the flexural third point strength test were cast, respectively. The strengths were calculated at three different curing periods i.e. 3rd day, 7th day and 28th day. The procedure laid down by IS: 516-1959 was followed for conducting the compressive strength test. The rate of load application being 14 N/mm2/minute, approximately using compression testing machine on 150 mm standard cubes. Three specimen averages were taken as the indicative value for the compressive strength.
The Split tensile test was carried out according to IS: 5816-1999. Quaternary concrete cylinders of size 150 diameter and 300 mm height were casted. After the specified period of curing, the test was conducted under the Compression Testing Machine with specimens fit into the split tensile setup. The test results were triplicate and later averaged to obtain the final split tensile value.
Flexural strength test was done on 100 by 100 mm c/s dimension and 500 mm span beam specimens, with a span of 400 mm between the two simple supports at the ends. This span of loading is the effective span of the beam. The beam specimen was loaded in the third point flexural testing setup under the Universal Testing Machine. The strength values obtained were averaged and the max central displacement to the failure of the all the specimens was noted. The test procedure followed complies with IS: 516-1999 (Reaffirmed 2004).
Analysis of Results
Analysis of workability test results
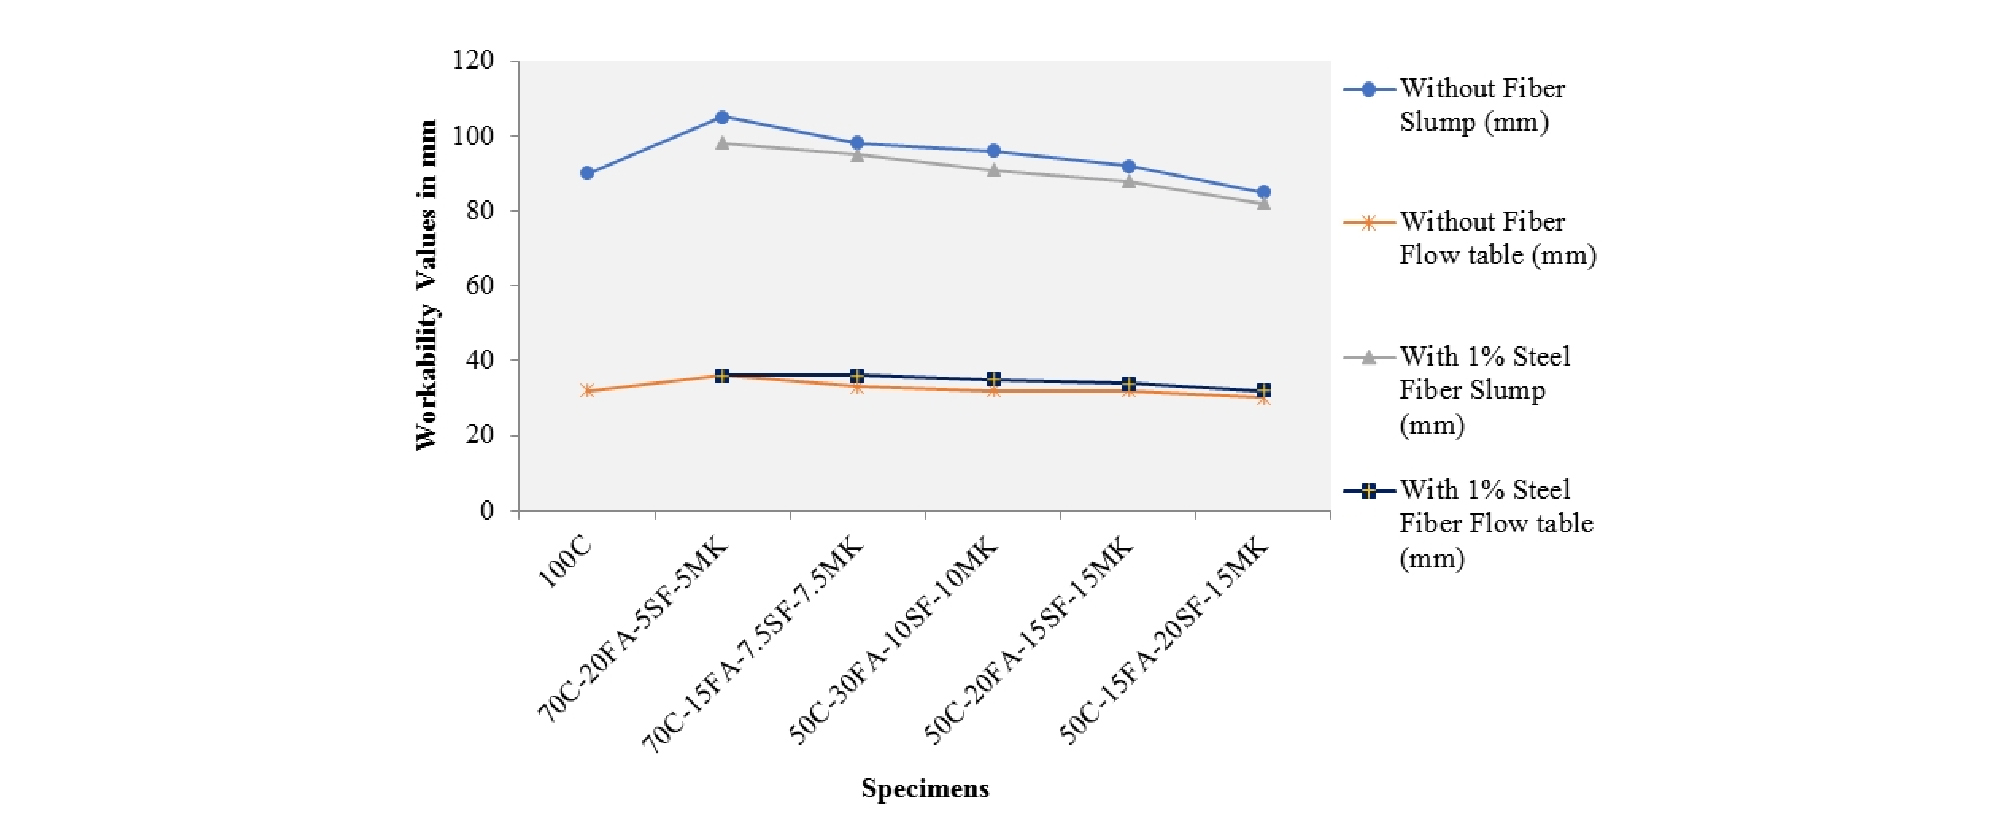
Higher the workability of a concrete mix, lesser is the energy required in placing and compacting of concrete. IS: 456-2000 lays down provisions for workability requirement as slump value measured as per IS: 1199 for different placing conditions. Refer to Figure 1 for workability test results. In the present study the samples prepared for testing had constant water to cementation material ratio of 0.42 and a super-plasticizer dosage of 1.2%. The workability for all the mixes ranges between 80 to 105 mm slump value and the flow table test results vary from 30 to 40 mm. The results have shown that control concrete has low slump as compared to the quaternary mixes except for the one with 15% flyash, 20% micro silica & 15% metakaolin for which the workability is appreciably less than control concrete. With the increase in micro silica (SF) content the mix becomes more and more sticky and the thus the workability reduces. The workability of the specimens with 1% fiber is lesser than the quaternary mixes with same amount of cement replacement & SCM proportions. The workability of the fiber reinforced specimens follows a same pattern of fluctuation with maximum slump obtained for S1 mix and the least for S5.
Analysis of compressive strength test results
The 3rd day, 7th day and 28th day strength of cubes in compression of the concrete mixes are presented in Table 3. It was found that the compressive strength of the specimens with 1% fiber replacement increased as compared to the quaternary specimens with the same level of replacement for a period of curing under. The maximum increase of 9.75%, 8.94% and 3.8% were observed on 3rd day, 7th day and 28th day of curing. The compressive strength decreased from QC1 to QC5 and S1 to S5 for all the curing periods presented in this paper. A drastic decrease in strength was observed from QC2 to QC3 for the 3rd day and 7th day of curing as the overall replacement level increased from 30% to 50%. The maximum decrease being, 5.7% from QC2 to QC3 and 12.3% from S2 to S3 at the 7th day of curing only. The same phenomenon was observed when the flyash percentage decreases and micro silica percentage increases. This observation is validated by the literature findings [17]. The literature also supports the results obtained from the test and also validates the increase of strength of quaternary concrete with increasing curing time [18-19]. The 28th day test results were promising; the strengths of QC1 and S1 were very close to that of the control mix.
Table 3. Compressive strength results
Analysis of Split tensile strength test results
The Split tensile strength values of all proportion of mixes show a similar trend. The tensile strength in the splitting of concrete clyliders increases with time of curing as tabulated in Table 4. The split tensile strength of the fiber reinforced specimen increased by a maximum of 2.47 times with respect to the corresponding quaternary mix at 3 days of curing. The ratio decreased with age of curing to 1.4 times minimum increase at 7 days of curing which further decreased to 1.25 times at 28th day of curing. The values of the split tensile strength of the fiber reinforced quaternary concrete samples were less in comparison with the control concrete for different ages of curing but the gap grew close with age. Mix S1 and Mix QC1 had the highest value of strength for all three periods of curing in this study. For 30% OPC replacement, the Mix QC1 had the highest split tensile strength and Mix QC3 with 50% OPC replacement showed the maximum tensile strength for all the three ages of curing. The split tensile strength of the mixes decreased with reduction in flyash replacement and with the increase of micro silica and meta kaolin content with for mixes QC1 & QC2 and mixes S1& S2. The strength also decreased with decreasing flyash and increasing micro silica with constant meta-kaolin for mixes QC3, QC4 & QC5 and mixes S3, S4 & S5. The same pattern of strength decrease was observed in the literature [17].
Table 4. Split Tensile strength results
Analysis of Flexural strength test results
Table 5 highlights the flexural strength test results of the quaternary concrete and fiber reinforced sample at 3rd day, 7th day and 28th day of curing. The strength of the specimens under flexural bending decreases with the increase with the increase in cement supplement from 30% to 50%. The flexural strength of the specimens was also found to decrease with the decrease in flyash content and with the increase in micro silica content. Using steel fibers the flexural strength of the specimens increases in comparison to the quaternary concrete of same SCM replacements. The flexural strength increased the most for S1 mix compared to other mixes at all the ages of curing under study with the highest being 127% at 3 days curing period and lowest being 14.26% at the 28th day of curing. The flexural strength of S1 & S2 samples was greater than the control mix at all the three curing periods. With the same metakaolin content, the flexural strength of specimens decreased from QC3 to QC5 and S3 to S5 with decreasing flyash content and increasing micro-silica content.
Table 5. Flexural strength results
Ductility and crack resistance
The ductility and crack resistance of the quaternary concrete mixes were enhanced by adding steel fibers. To quantify the enhanced ductility the maximum central deflection at the failure of the beams under bending flexure was studied. Table 6 highlights the maximum deflection value obtained under the third point flexure test. The central displacement saw a downward slope with the increase in percentage cement replacement from 30% to 50%. The ductility decreased from QC1 to QC5 but the C0 mix i.e. the control mix had the highest deflection to failure for all the three periods of curing. Among the fiber reinforced mixes the S1 specimen had the highest and the S5 specimen had the least value of deflection for all three ages of curing. On adding 1% steel fiber to the quaternary concrete samples the ductility increases significantly by a maximum of 135% for S2 specimen at the 28th day of curing. The fibers bridged the crack and thus increase the post cracking strength of the specimen.
Table 6. Maximum displacement at failure under bending at 3rd day, 7th day & 28th day of curing
Empirical relationship between properties of quaternary and FRC
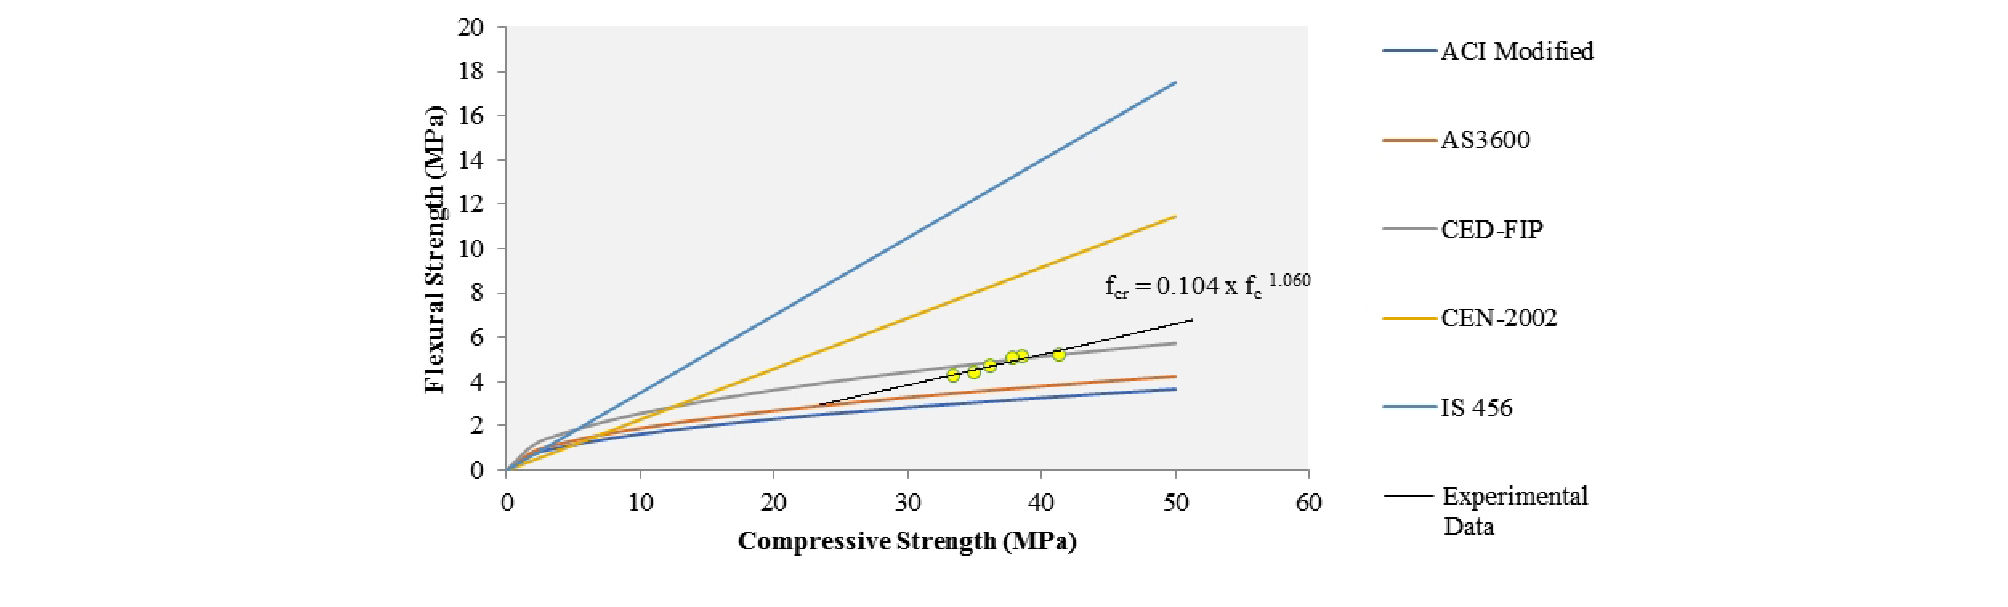
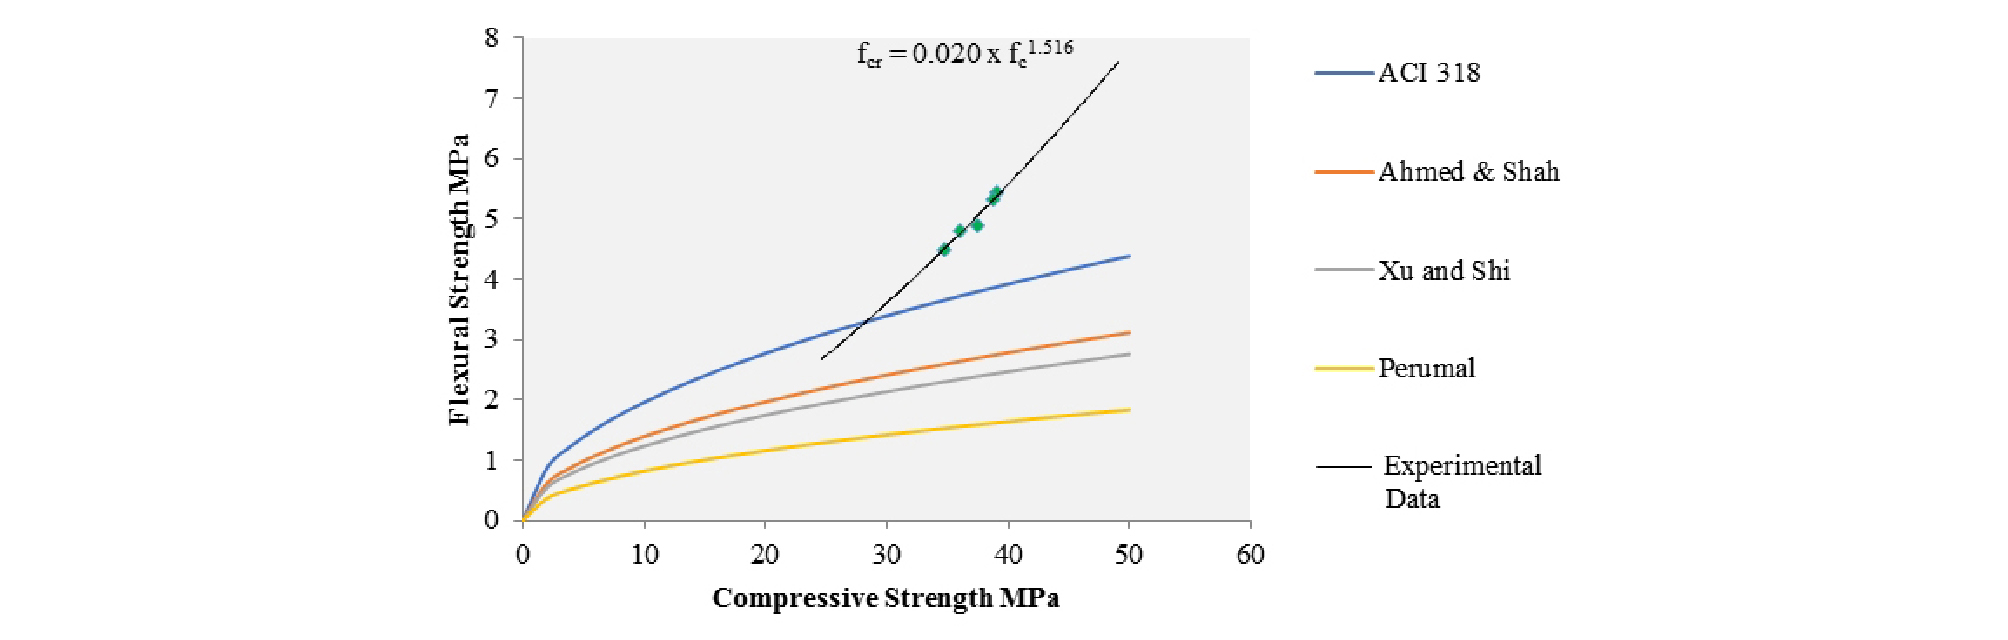
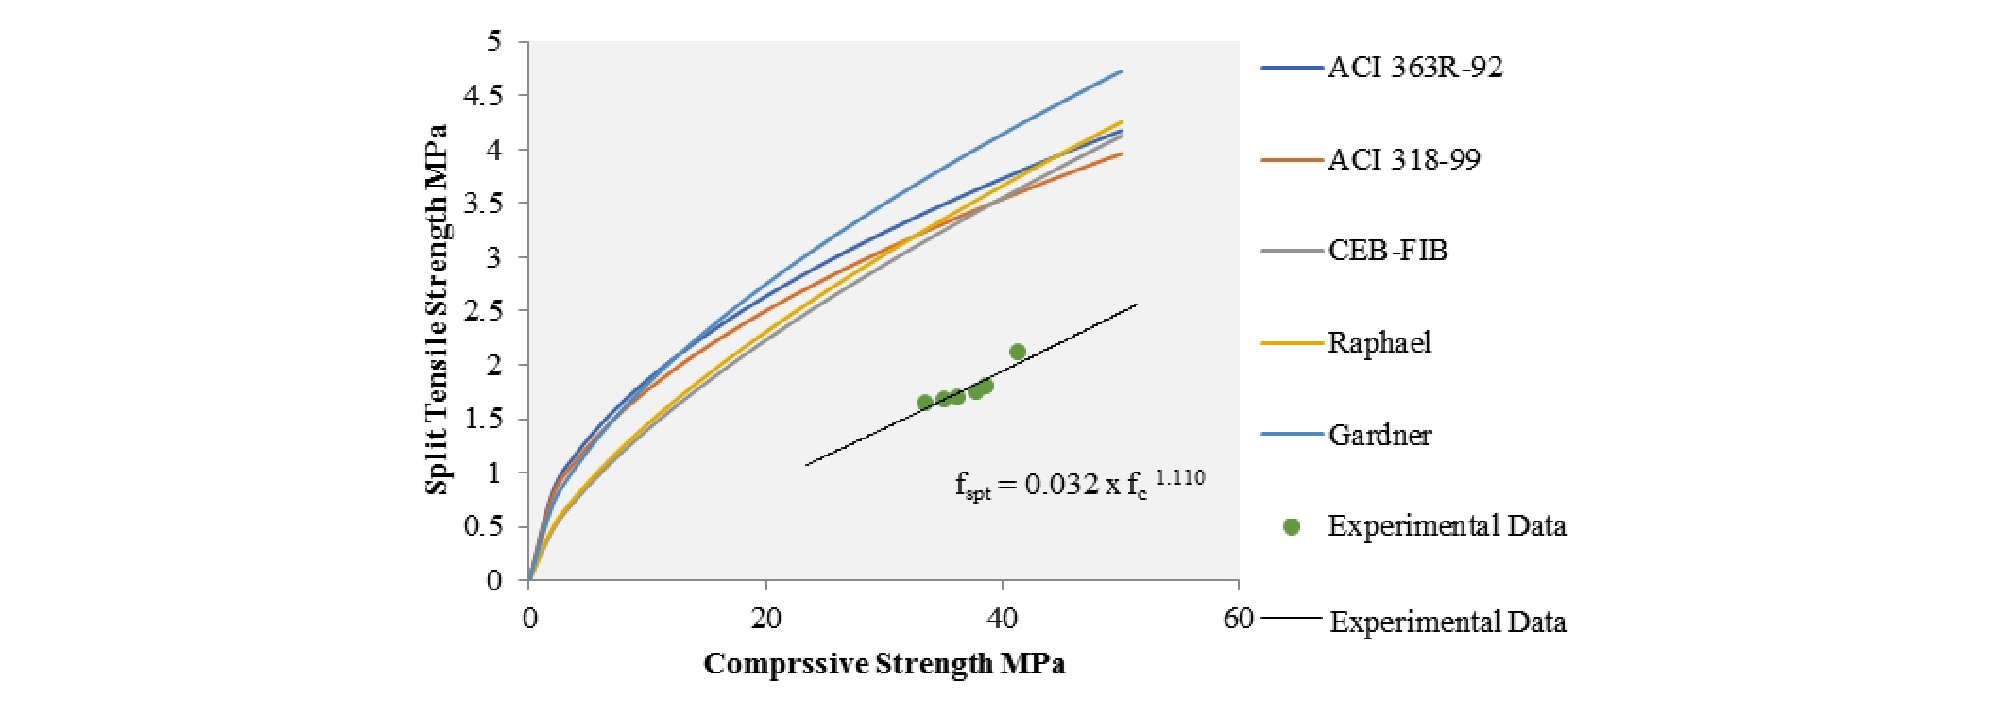
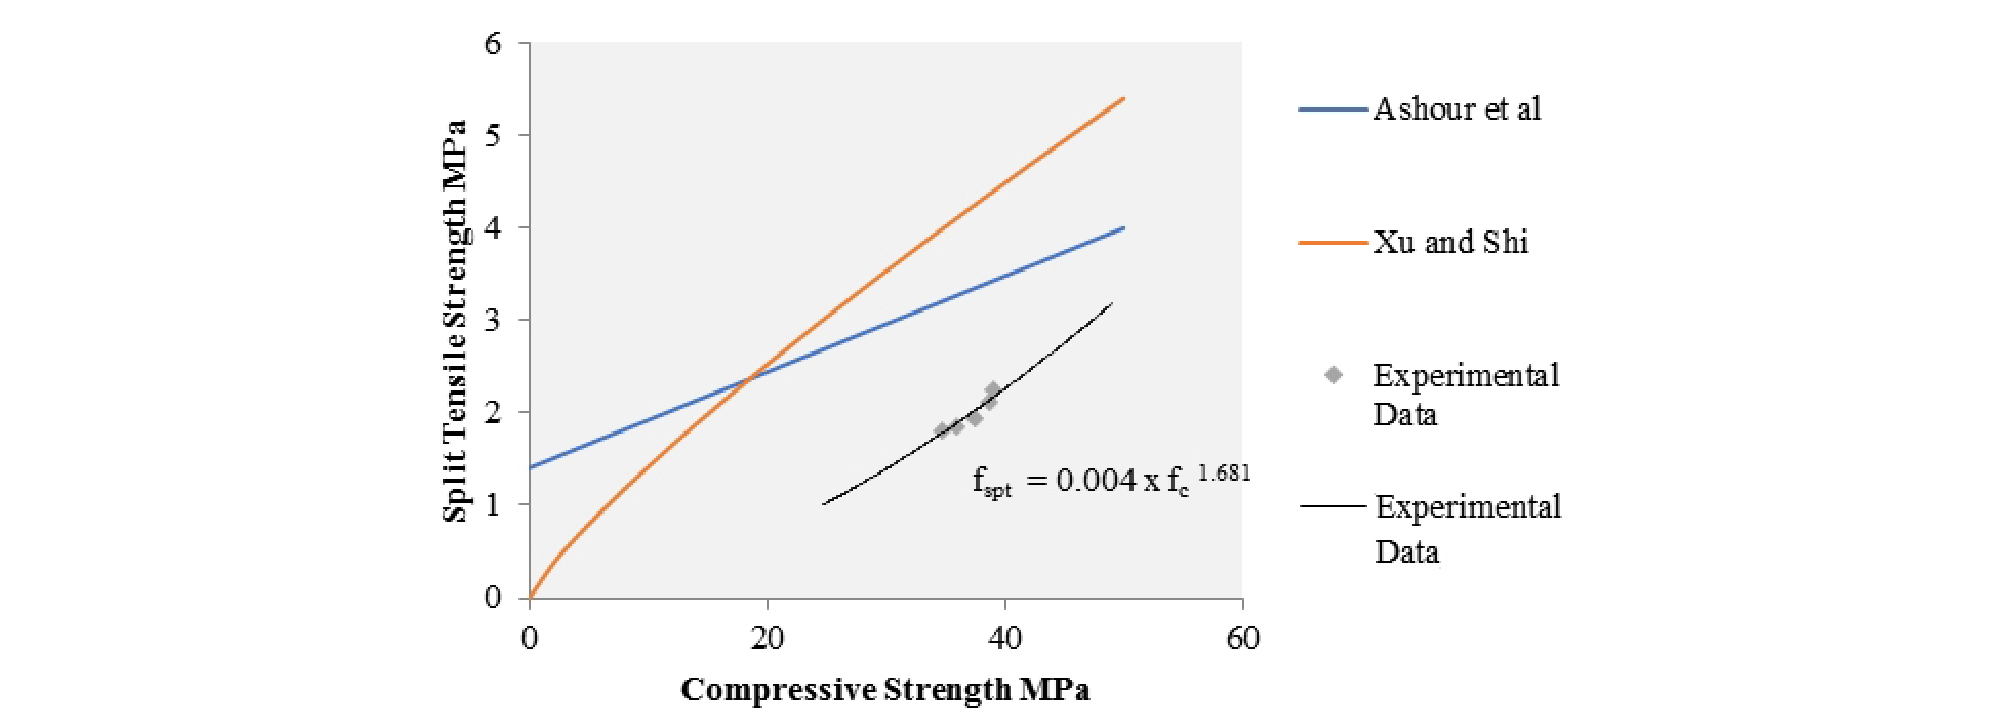
The equation relating the physical properties of concrete is numerous and many researchers have published their work out of which some of them are adopted by various standards. Basically, all these derived relationships are empirical relationships between compressive, flexural, direct tensile and split tensile strength of concrete. Table 7 and Table 8 highlights the relationship between compressive and flexural strength while Table 9 and Table 10 highlights some published empirical formulae relating compressive and split tensile strength for normal concrete and quaternary concrete at 28th days of curing. Figure 2, Figure 3, Figure 4 and Figure 5 graphically shows the comparison among the obtained experimental data points and predicted values as given by the empirical relationships.
The plot between flexural and compressive strengths of quaternary concrete was in close agreement to curve proposed by CEP-FIP [23] and AS3600 [22]. The experimental plot were below CEN 2002 [24], ACI 318 [21] and above the curve proposed by IS 456-200 [25]. The experimental data point plot for the fiber reinforced quaternary specimens was higher than the curves proposed by various researchers as shown in Figure 3. The experimental plot predicting the split tensile strength with respect to the compressive strength of the quaternary concrete samples were below the values proposed by the empirical curves. Figure 4 highlights the plot the empirical relationship published by the researchers. The equation for the best fitting curve for the obtained results as shown in Figure 5 is an underestimation of the values predicted by empirical curves.
Table 7. Empirical equations relating compressive strength and flexural strength of concrete at 28th day.
| ACI Modified [20] | AS 3600 [21] | CED-FIP [22] | CEN-2002 [23] | IS 456 [24] |
Table 8. Empirical equation relating compressive and flexural strength of FRC
| ACI 318 [25] | Ahmed & Shah [26] | Xu and Shi [27] | Perumal [28] |
Table 9. Empirical equation relating compressive and split tensile strength of concrete at 28th day
| ACI 363R-92 [29] | ACI 318-99 [25] | CEB-FIP [22] | Raphael [30] | Gardner [31] |
Table 10. Empirical equation relating compressive and split tensile strength of FRC
| Ashour et al [32] | Xu and Shi [33] |
Conclusion
1) The workability of the quaternary mixes was higher as compared to the control concrete except for QC5 mix. The reason behind the increase in workability is due to replacement of cement by SCM’s. The QC5 mix has reduced workability as the mix becomes sticky with the increase in micro silica content. While the fiber reinforced specimens showed lower slump values as compared to the quaternary mixes with the same proportion of SCM content since the mobility of the mix is reduced.
2) The strength of the quaternary concrete samples in compression decreases from QC1 to QC5, a major drop was observed in the transition from QC2 to QC3 where the percentage of replacement changes from 30% to 50%. The same trend was observed for fiber reinforced specimens. The QC1 and S1 mix showed the best result.
3) In all the cases, the split tensile strength showed good results. The results showed improvement quaternary concrete mixes to fiber reinforced specimens. The maximum improvement was observed for mix with SCM proportions as 50% cement, 15% flyash, 20% silica fume and 15% meta kaolin in 3 days curing period while this rate reduced with the age of curing as the rate of CH utilization picks up the pace. The split tensile strength was maximum for QC1 and S1 specimens but was less than the control concrete.
4) Mix QC1 and Mix S1 showed the highest values of flexural strength at all the three periods of curing. The flexural strength of all the fiber reinforced specimens were higher than their corresponding quaternary concrete specimens with the same SCM percentage. The flexural strength values of these two mixes namely, QC1 and S1 at all the three stages of curing were appreciably higher than the control concrete.
5) The ductility of the fiber reinforced specimens in bending was expressed in terms of maximum central deflection at failure. The quaternary concrete without fibers exhibited lesser ductility with the maximum for QC1 and minimum for QC5. The fiber reinforced samples failed at a higher central deflection. Mix S1 had the highest and mix S5 had the lowest displacement at failure for all the three stages of curing.
6) The experimental results for flexural and split tensile strength was plotted against compressive strength at 28th day of curing. The plot showed good agreement with various empirical equations for flexural strength of quaternary concrete but the results for split tensile tests were lower than the proposed empirical values for both quaternary and fiber reinforced concrete.
