

Introduction
Portland cement is hydraulic cement; it derives its strength by reacting with water. So, when water is added to the cement hydration begins but it literally never ends. The phases present in cement in contact with water form hyd-rates and calcium hydroxides. The cement generally consists of four major phases viz. alite, belite, celite or alumi-nate and ferrite the percentage of which can be approximately estmated by Bogue’s [1] equations and further modified by Taylor [2]. The powder XRD method is employed to identify the major and minor phases present before and after cement hydration. These phases essentially contribute various other properties of cement. Gene-rally, the formation of these minor phases are temperature and humidity dependent and their structure is also affec-ted by the presence of other oxides in cement. The XRD analysis is based on Bragg’s [3] principle and the Bragg-Brentano geometry is used in obtaining the diffraction pattern. Alite (C3S-tricalcium Silicate) it forms the major part in cement composition about 50% by mass. Alite has polymorphs belonging to three different families viz. Triclinic (T1, T2, T3), Monoclinic (M1, M2, M3) and Rhombohedral (R) depending upon the clinkering tempe-ra-ture. Jeffrey [4] made the first determination of crystal structure of alite. Monoclinic (M3) alite is similar to the mineral named Hatrurite. Belite (C2S-dicalcium silicate) exhibits three to four polymorphs and it reacts with water and forms hydrated dicalcium-silicate. α-C2S, β-C2S and γ-C2S are the three polymorphs. Though αH belite and αLbelite are also present. Larnite is the naturally occurring mineral similar to belite. Aluminate (C3A-tricalcium aluminate) is the least abundant phase in a Portland cement. C3A can incorporate Na+ by substitution of Ca2+ ion in an otherwise vacant site, thus giving solid solutions of general formula Na2xCa3-xAl2O3. Its crystal structure is cubic but monoclinic and orthorhombic aluminate also exists. Ferrite (C4AF- tetracal-cium-aluminoferrite) phase is very similar to aluminate phase with orthorhombic crystal structure. The mineral similar in composition to ferrite is called Brownmillerite. Other minor phases present in cement include oxides such as Na2O, K2O, SO3, MgO, loss on ignition, insoluble residue etc. These oxides are not present in cement in their pure form but exist in combined forms. The minerals resembling these combined phases include aphthitalite, lang-beinite, arcanite, periclase, syn-genite, calcite, anhydrite and lime (free lime). Cement parameters, Lime Saturation Factor (LSF), Alumina Ratio (AR), Silica Ratio (SR), Alkali content expressed as Na2O equivalent, SO3 limit the composition of cement minerals based on requirements. These values of these parameters were also identified and their BIS limits for these factors are listed in Table 1. In addition to the above parameters percentage liquid, burnability index and burnability factor give an idea of solid solution formed during manufacture of cement. The LSF controls the ratio of alite to belite in clinker. A clinker with a higher LSF will have a higher proportion of alite to belite than will a clinker with a low LSF. Alumina Ratio (AR) determines the potential relative proportions of aluminate and ferrite phases in the clinker. IS 8112-1969 [5] also limits the percentage of SO3 in cement to prevent abnormal expansion. In ordinary Portland cement clinker, the AR is usually between 1 and 4. A high Silica Ratio (SR) means that more calcium silicates are present in the clinker and less aluminate and ferrite. SR is typically between 2.0 and 3.0.
With the progress hydration different phases like C-S-H gel (tobermorite), Calcium hydroxide (portlandite), AFm, AFt and other phases such as hydro-garnets form which eventually converts cement to an artificial rock. Gene-rally, two different types of C-S-H gel structures has been observed found in researches done by Viehland et al. [6], Slegers et al. [7] and Jenning et al. [8] and other chemists. These two forms are in close resemblance with 1.4nm tobermorite and Jennite. A gelatinous calcium silicate hydrate, called plombierite, occurs in nature. Calcium Hy-droxide (CH) is also known by mineral name portlandite. It forms form C3S and to a lesser extent form C2S. It occupies around 15-20% of the volume of the hydrated cement paste. AFm is shorthand for a family of hydrated calcium aluminate phases structurally related to hydrocalumite and occurring mainly in hydrated cement paste. A representative formula is [Ca2(Al,Fe)(OH)6] ·X· xH2O where X equals an exchangeable singly charged (e.g. chlo-ride) or half of a doubly charged anion (e.g. sulfate, carbonate and aluminosilicate). Some Fe(III) may also substi-tute for aluminium. The AFm phases consists of hydroy–Afm, hemi-carboaluminates, mono-carbo aluminate, mono-sulpho aluminate, stratlingite, vertumnite, kuzelite and Friedel’s salt found in cement concrete exposed to chlorine. AFt (Al2O3-Fe2O3-tri) phases have the general constitutional formula [Ca3(Al, Fe) (OH)6•12H2O]2•X3• xH2O, where x is, normally at least, ≤2and X represents one formula unit of a doubly charged, or, with reservations, two formula units of a singly charged anion. The most important AFt phase is ettringite, [Ca3Al(OH)6•12H2O]2- (SO4)3-2H2O or C3A•3CaSO4•32H2O. A phase of or near this composition is formed during the early hydration of most Portland cements. Ettringite is trigonal, with a=1.123 nm, c = 2,150 nm, Z = 2, Dx=1,775kgm-3; the space group is P31c.
Many attempts of studying cement hydration were done by many researchers around the world. The environ-mental degradation of the concrete infrastructure has been discussed by Tomislav Matusinovic et al. [9]. The XRD results showed small quantity of ettringite, calcium carboaluminate hydrate and Friedel’s salt, and a complete leach of portlandite, while TGA results indicated small quantities of hydrates. Samples taken from flawless inside of the concrete layer showed expected quantities of hydrates for the concrete. The study highlights the capabilities of the methods for the analysis of concrete towards the determination of hardened cement paste degradation. The inno-vation in X-Ray technologies with the introduction of fast detector along with Rietveld analysis process incurred development of QXRD in cement manufacturing plants for cement quality control [10-17]. F. Guirado et al. [18] worked on the quantitative Rietveld analyses of twenty samples of CAC. As compared with conventional XRD, synch-rotron powder diffraction permitted to find new minor phases, improve the characterization of solid solutions of iron rich CAC phases and reduce preferential orientation and micro-absorption effects. Jumate Elena et al. [19] performed a study on type I Portland cement with respect to the cement hydration processes performed at various time intervals. The methods used concerned X-ray diffraction and electronic microscopy applied to define materials and to understand the changes occurring in mineral compounds (alite, belite, celite and brownmillerite) during their modification into hydrated mineral compounds (tobermorite, portlandite and ettringite). T. Matschei et al. [20] studied the solubility and stability of AFm phases in Portland cement. The paper also gives an idea of the thermodynamic stability of the monosulphate phases and the amount of substitution. The paper helped my research in choosing the Afm phases. J. Stroh et al. [21] analysed temporal sulphate transport in cement matrices using SyXRD and he highlighted that the cement matrices containing blends shows higher resistance against sulphate attack.
This study aims to understand cement hydration of OPC-43 grade in depth and also attempts to identify the various chemical phases present in cement which are not generally discussed. The changes of phases that occur during hydration process were analysed and the obtained x-ray diffraction datas interpreted to give an outline of overall hydration process. The outcome of this study will be helpful in quantitatively defining cement hydration and will aid in decision making processes related to placement and curing of OPC concrete.
Materials and Methods
Quantitative analysis of OPC-43 grade cement includes material collection, sample preparation, x-ray diffraction test, analysis and interpretation of results. The details about the material used and the procedure followed are elabo-rated in section below.
Materials
OPC-43 conforming to IS 8112- 1969 [5] grade cement analysed using powder x-ray diffraction at various stages of hydration. OPC-43 grade cement was analysed for determining the major and minor cement minerals. The cement paste samples made at initial setting, final setting, 1 day, 3 days, 7 days, 14 days, 21 days, 28 days and 56 days were also analysed to study the phase changes. The initial and final setting time of the cement was found out to be 35 minutes and 185 minutes obtained as per IS 4031-Part 5-1988 [22]. The compressive strength test was performed on cement mortar cubes as per IS 4031-Part 5:1988 [22].
Methods
Sample Preparation
About 10 g of cement was taken out of the bag, sieved using 75 microns IS sieve, the amount passing was oven dried at 55̊C for 10 minutes to remove any absorbed moisture. The cement is then enclosed and sent to the laboratory for XRD testing. 3 samples of the cement were analysed. ASTM C1365-06 [23] was also referred. For the hardened cement slurries, the cement cubes were made by adding water required for standard consistence here it is 33% by weight of cement calculated as per IS:4031 Part 4-1988 [24], placing in a mould, unmoulded after 24 hours and placing it in the curing tank. The cubes are then taken out of curing tank at their respective ages of curing, surface water was removed by sun drying for about 15 minutes, and then the samples were crushed to smaller bits using ball mill. Samples obtained for ball mill were further crushed and sieved using 75-micron IS sieve. The fine particles passing through 75-micron sieve were further grounded using a mortar and pestle. The further ground sample were sieved through a 10-micron sieve. 75% of fines passing through 10-micron sieve and 25% of fines passing through 75-micron sieve were mixed to form a representative sample. The samples are then enclosed and sent to lab for testing. The samples for initial and final setting times as per IS 4031, Part 5-1988 [22] were prepared in a slightly different manner. The samples were plastic and thus had to be oven dried at 110oC for 15 minutes. Rest of the procedure is same only ball mill is not required in this case. The sampling for compressive test on cement mortar was done as per IS: 3535-1986 [25].
XRD Analysis
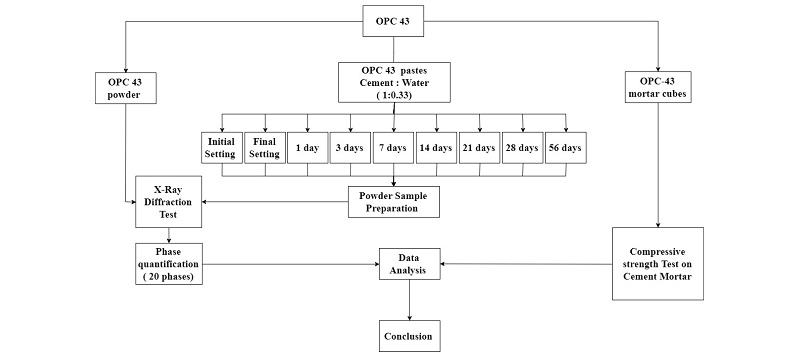
The powder X-Ray diffraction analysis was done with Bruker’s D8 Advance diffractometer. The CuKα radiation of wavelength 1.5418740 Å, theta range of 10-90 degrees, 25 kV voltage and Bragg-Brentano arrangement was employed in the study. The phase quantification was done using Match software with maximum of 20 entries of the raw XRD output. Figure 1 below shows Bragg-Brentano arrangement used in the experiment. The raw XRD data obtained from the spectrometer was analysed by Match XRD software. The analysis involved reduction of background noises in the spectral data, profile fitting, theta correction, peak search and phase matching. The matched phases with respective composition in mass percentage were obtained. The γ-belite is similar to olivine group which does not participate in hydration and are mostly absent in cement. For the purpose of study, it is included as one of the phases similarly monoclinic and orthorhombic aluminate are rare in cement. The background radiation, diffraction peaks and unidentified peak area at different stages of hydration are given in Table 2. The step by step procedure followed in this study starting from sample preparation to phase quantification and data analysis is explained with the help of a flow chart shown in Figure 2.

Results and Discussions
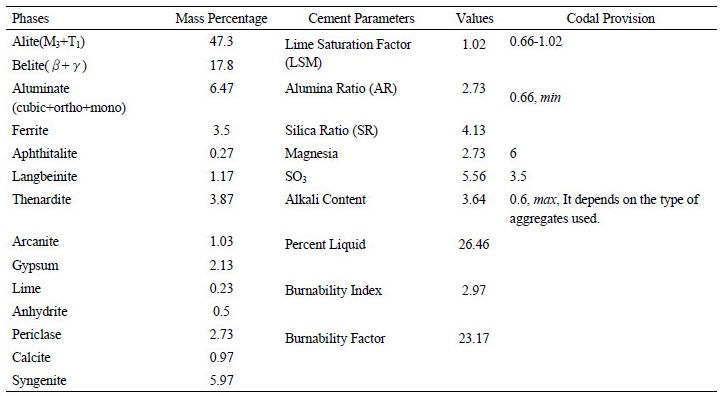
Both the major and minor phases were identified and the results in mass percentages are presented in Table 2. The oxide composition of the cement was found out calculated based on the chemical formulae of the selected phases. The cement was found to be composed of 47.3% of alite, 17.8% belite, 6.47% aluminate and 3.5% ferrite by mass. The total minor phases comprised of 10.14% with gypsum being 2.13% and magnesia being 2.73% by mass. Out of 47.3% alite, 20.07% is M3-Mg stabilised and 27.23% is T1alite. 17.8% belite is composed of 15.13% β-C2S and 2.67% γ-C2S. Ortho-rhombic aluminate is 0.9%, cubic aluminate is 2.47% and monoclinic aluminate is 3.1% by mass. Ferrite phase had three polymorphs of brownmillerite with different stoichiometric ratios of aluminium, calcium and oxygen. Refer Figure 3a. Owing to these phase compositions the oxide composition was calculated and is shown in Figure 3b.
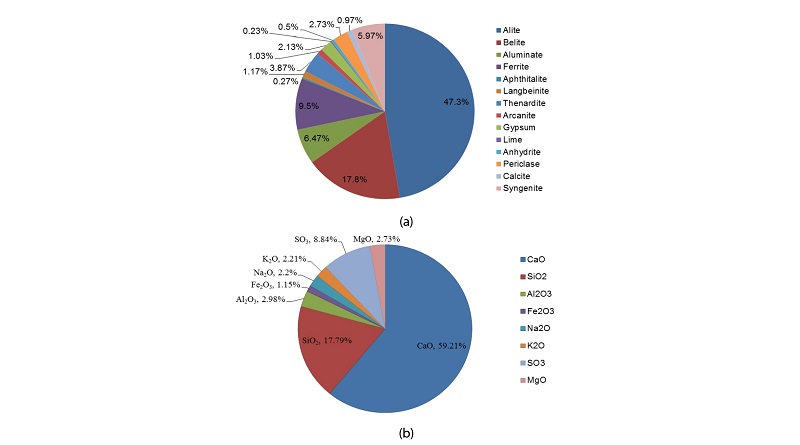
The lime content of cement is 59.21%, silica content is 17.79%, alumina content is 2.98%, iron oxide content is 1.15%, alkali content (Na2O equivalent) 3.64%, SO3 content is 8.84% and magnesia content is 2.73% by mass. Based on the oxide composition the cement parameters were calculated. The Lime Saturation Factor (LSM) is 1.02, Alumina Ratio (AR) is 2.73 which is quite high, Silica Ratio (SR) is 4.13, percentage liquid in cement melt phase is 26.46, burnability Index is 2.97 and burnability factor is 23.17. Higher LSM indicated higher alite to belite ration in cement clinker, this was true as it had higher alite.
The phase identification of hydrated cement pastes at different ages of curing is done by following similar procedure The Figure 4a shows the variation of four major cement compounds namely alite, belite, aluminate and ferrite with hydration. These compounds are used up during hydration and hydrated products are made.
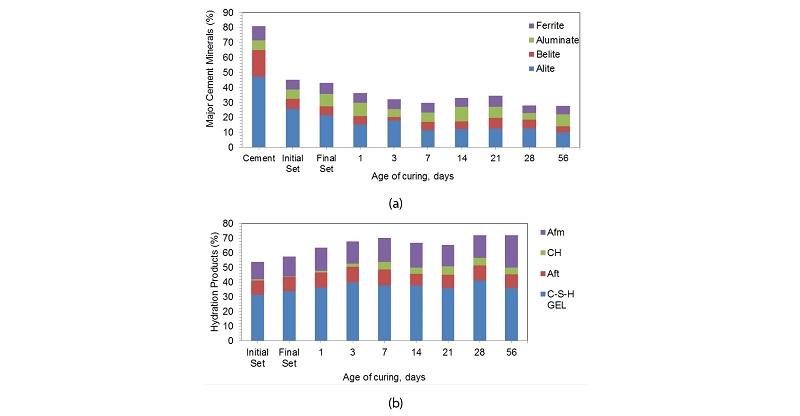
Table 2 gives a detailed output of the XRD analysis performed using Match software and the values of each phase are given in mass percent at different stages of hydration. The alite composition in cement gets reduced to 25.8 mass percent within the period of initial set, the value drops to 21.5 percentages by mass in final setting. It keeps getting consumed and reaches a value of 10% at 56 days of hydration. The belite percentage reduces from 17.8% to 4.13% by mass at 56 days of hydration. The belite percentage is reduced the most during the initial set of cement. The ferrite and aluminate percentage follows a zigzag pattern as the hydration progresses. Figure 5 high-lights the percentage increase in hydrated productsat different stages of hydration. The hydrated products formed during initial setting of the cement are considered as standards for Figure 4. The maximum increase is observed for C-H at day 1 which is around 3.1 times and the maximum decrease was observed also in C-H during the interval of final setting around 7.24 times the value in initial setting. The decrease in the products can be justified by the abnormal and random fluctuations in composition of polymorphs of different hydrated phases. For example, the decrease in Aft phase at 14 days is due to decrease in thaumasite content by almost half as given in Table 2. Similarly, the decrease in C-S-H at 21 and 56 days is due to decline of T1alite and M3alite content in cement.
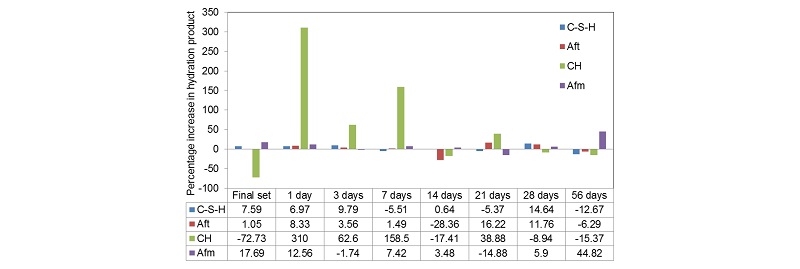
Table 2. Phase composition of hydrated pastes at various ages of curing 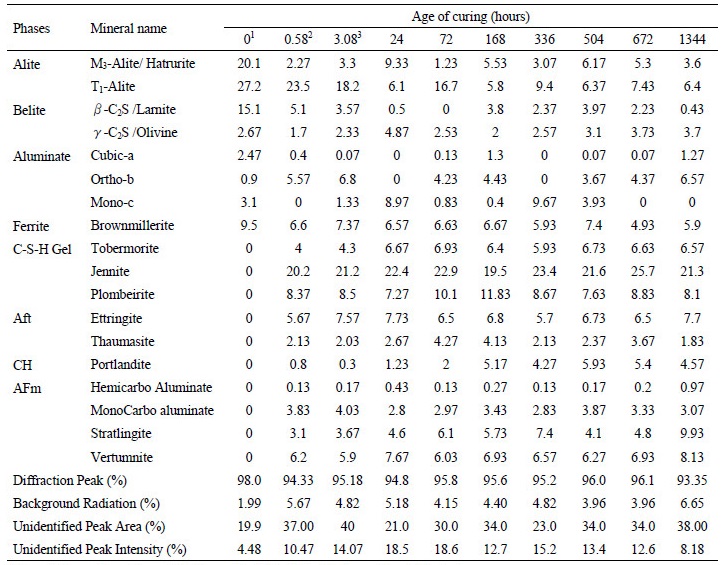 | |
Note: - 1. Composition of cement, 2. Composition for initial set, 3. Composition of Final set | |
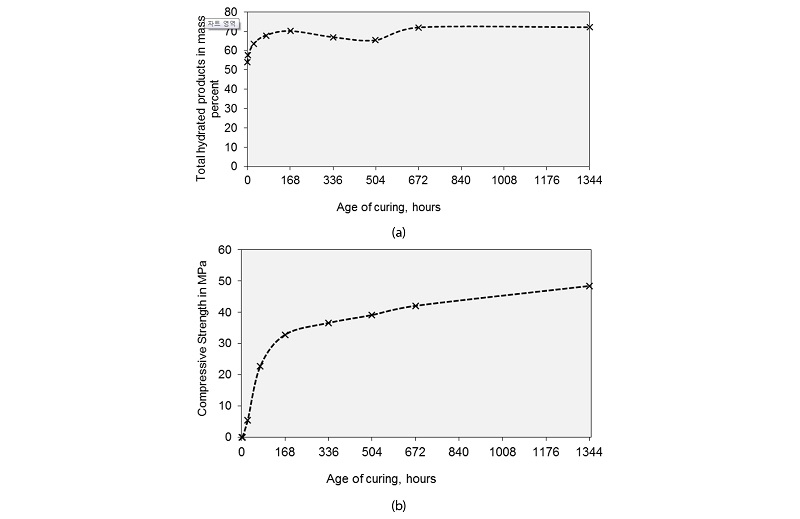
The cement minerals are used up and the hydrated products are formed in the process of hydration, this is shown by Figure 6. The decreases in the major cement phases follow the similar pattern as that of the increase in total hydrated products with age of hydration. Initially total major cement minerals namely alite, belite, aluminate and ferrite comprised of 71.57% by mass and get reduced to 21.97% by mass at 56 days of hydration. Similarly, the total hydration products are zero and reach a value of 72.17% by mass at 56 days of hydration with a maximum increase at initial set of cement.
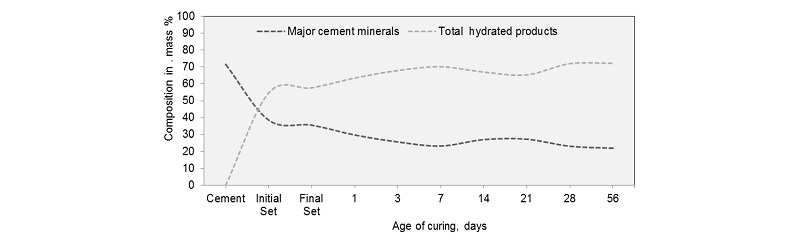
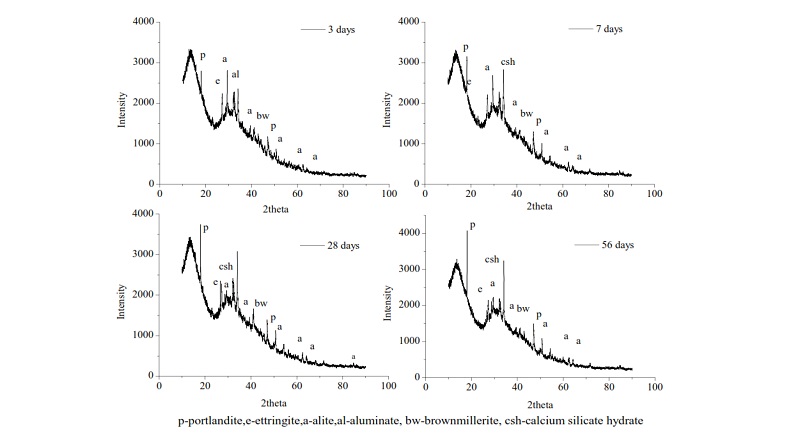
Figure 7 shows peaks obtained from the diffractometer at various stages of hydration. The peaks for ettringite is observed in early phases in hydration, due it exhaustion to monosulphate phases with depletion of gypsum. Peaks for calcium silicate hydrate, aluminates, alite, brownmillerite, portlandite were also observed. Portlandite peaks were more prominent at later stages of hydration. The peaks for calcium silicate hydrate grew with age.
The maximum change or the maximum slope is obtained during initial setting. This is evident form Figure 8a. By referring to the data’s given in Table 2 column 2, hatrurite or M3 alite reduces drastically while the T1alite reduces by 13.6% only. Larnite decreases by 66.25% followed by 30% decrease in final setting. Hatrurite observes a jump in day 1 and is accompanied a rise in olivine content. Brownmillerite has a rather steady decline with an increase limited to 24.79% on 21st day. The total hydrated products formed increases with age up to 7 days. After 7 days, there was a decline in total hydrated products up to 21st day. This change is due to the decrease in AFm phase by 14.88% and decrease in CSH by 5.37%. At 28 days of curing the percentages of AFm increase and its keeps on increasing up to 56 days. While Aft phases decreases this can be accounted by the accelerated hydration of aluminates. Portlandite percentage increased after day 1, though there is a possibility of leaching out of calcium hydroxide. There is a negligible variation in the hydrated products between 28th and 56th days of curing. The 7th day strength of cement mortar was 22.66 MPa, 28th day strength was 42.07 MPa and 56th day strength was 48.45 MPa. Maximum rise in strength of 307.55% was observed from, day 1 to day 3 and 44.88% increase from day 3 to day 7. During the same duration, the percentage increase in hydrated products was 6.97% which was attributed by increase in all the hydrated phases. The variation of strength with age of curing is shown in Figure 8b.
Conclusion
OPC-43 grade cement samples and OPC-43 cement paste samples were collected, casted and tested to quantify the chemical composition of the cement. A total of 20 phases including major and minor phases were identified and the changes in these phases were quantified. Some significant changes in these phases were observed with age of hydration. Through the experiments and results obtained the following conclusions can be drawn:
∙The lime saturation factor, the alumina ratio, the silica ratio and the Magnesia content satisfied the values stipulated by the code. The SO3 content was more by 2.06 mass % and the alkali content was 5.1 times higher than the value stipulated in IS 8112-1969. High SO3 content is the result of use of excess gypsum in retarding flash set. This excess gypsum is due to the presence of alkali rich aluminate phases in cement.
∙The major cement minerals reduced from 71.57 mass percent before hydration to 21.97 mass percent at the end of 56 days. It indicates that around 22masspercentof cement mineral don’t play any role in strength gain and remain unutilized due to hydrates precipitation on the outer surfaces. This signifies that cement hydration is a life-long process.
∙The total hydration products formed starts from zero and reaches 72.17 percent by mass at the end of 56 days with a maximum increase observed during initial setting. Moreover, escalation in compressive strength in cement mortar was observed around 307.55% between 1st and 3rd day of curing and 44.88 increase was observed between day 3 and day 7. Therefore, by ensuring ideal curing conditions during initial setting time very good early strength and long-term durability of concrete and mortar can be achieved.
∙The hydration products formed increases up to 7 days after which a decline is observed up to 21 days. This change can be justified due to decrease in Afm phases by 14.88% and decrease in CSH by 5.37%. It indicates steady development of strength gain after 7 days.
∙There is a negligible variation in the hydration products between 28 days and 56 days of curing, which is the indication of hardened state of concrete and no further curing is required.
